Everything You Need to Know About Retail Data Analytics
Retail data analytics turns sales, inventory, and field data into actionable insights that drive faster business decisions.

Walk into any CPG sales review, and you'll hear the same complaint: the numbers looked fine on the dashboard, but the shelf told a different story. A distributor over-ordered. An outlet went dark for three days. A promotion ran everywhere except the ten stores that actually needed it. This is the last-mile execution gap, and it's exactly the problem retail data analytics exists to close.
For sales directors and C-suite leaders running CPG and FMCG portfolios, data-backed decision-making has become the operating system for growth. The payoff is measurable- McKinsey's analysis, cited by NielsenIQ, shows that data-driven CPGs can increase net sales value by 3 to 5 percent simply by acting on what their numbers are telling them. Consider this your definitive retail data analytics guide.
What Is Retail Data Analytics?
Retail data analytics is the practice of collecting, structuring, and interpreting data from every point in the value chain, orders, inventory, outlet visits, pricing, promotions, and consumer behaviour, to make faster, more accurate business decisions. It's broader than a sales report or a static dashboard; done well, it connects what's happening on the shelf to what's happening in the boardroom.
For CPG and FMCG brands specifically, this means bridging two worlds that have traditionally lived in silos: the field (route-to-market execution, outlet coverage, merchandising compliance) and the back office (demand planning, trade spend, P&L). A mature analytics practice doesn't just tell you what sold last week. It tells you why, predicts what's coming, and, increasingly, recommends what to do next. That progression is the backbone of every good
Types of Retail Analytics
Not all analytics answer the same question. This category generally splits into four types, each building on the one before it in sophistication and business value, and each answering a different question a CPG sales leader asks every week.
1. Descriptive Analytics- what happened
This is the foundation: sales volumes, outlet coverage, order fill rates, and category performance over a given period. Descriptive analytics answers “what happened,” typically through dashboards, scorecards, and standard reports. It's essential, but on its own it's rear-view mirror thinking, useful for accountability, insufficient for strategy.
2. Diagnostic Analytics- why it happened
Diagnostic analytics digs into the “why” behind the numbers. Why did a particular territory underperform? Why did a promotion fail to move volume in one region but succeed in another? This layer correlates variables, distributor stock levels, outlet visit frequency, competitor activity, weather, local events, to isolate root causes instead of guessing.
3. Predictive Analytics- what's next
Predictive analytics uses historical patterns, seasonality, and external signals to forecast what's likely to happen, demand spikes ahead of a festival, stock-outs before they occur, or which outlets are at risk of churn. This is where the discipline starts moving from reactive to proactive.
4. Prescriptive Analytics- what to do about it
The most advanced layer, prescriptive analytics, recommends specific actions: which outlets to prioritize this week, how much stock to push to which distributor, or which SKUs need a corrective pricing action. It turns insight into a to-do list for the field team, not just a chart for the boardroom.
At FieldAssist, this progression from descriptive to prescriptive is exactly where decision intelligence lives, turning fragmented retail execution data into the next best action for every sales rep, every distributor, and every outlet, every single day.
How Does Retail Analytics Work?
The engine behind this discipline runs on a continuous loop, not a one-time report. It typically moves through four stages, and most CPG and FMCG organizations already have pieces of each stage in place, the gap is usually in how well those pieces talk to one another:
- Data collection
Information flows in from multiple sources: point-of-sale systems, distributor management systems (DMS), sales force automation (SFA) apps, outlet visit data captured by field reps, and third-party market data. For CPG brands with thousands of outlets across urban and rural geographies, this alone is a significant data engineering challenge.
- Integration and cleaning
Raw data is fragmented, duplicated, and inconsistent across systems. Before any retail business intelligence platform can produce a usable insight, this data needs to be unified into a single, trustworthy source of truth, matching outlet IDs, standardizing SKU names, and reconciling conflicting entries.
- Analysis
This is where descriptive, diagnostic, predictive, and prescriptive techniques are applied, usually through a mix of dashboards, statistical models, and increasingly, AI-driven algorithms that can process volumes no human analyst could handle manually.
- Activation
The final and most frequently skipped step. Insight that stays in a dashboard changes nothing. Activation means pushing the recommended action, restock this outlet, correct this price, visit this distributor today, directly into the workflow of the person who can act on it, ideally within the same SFA or field app they already use.
What Data Should Retailers Track?
Not every metric deserves a place on the executive dashboard. CPG and FMCG leaders generally need visibility across four categories.
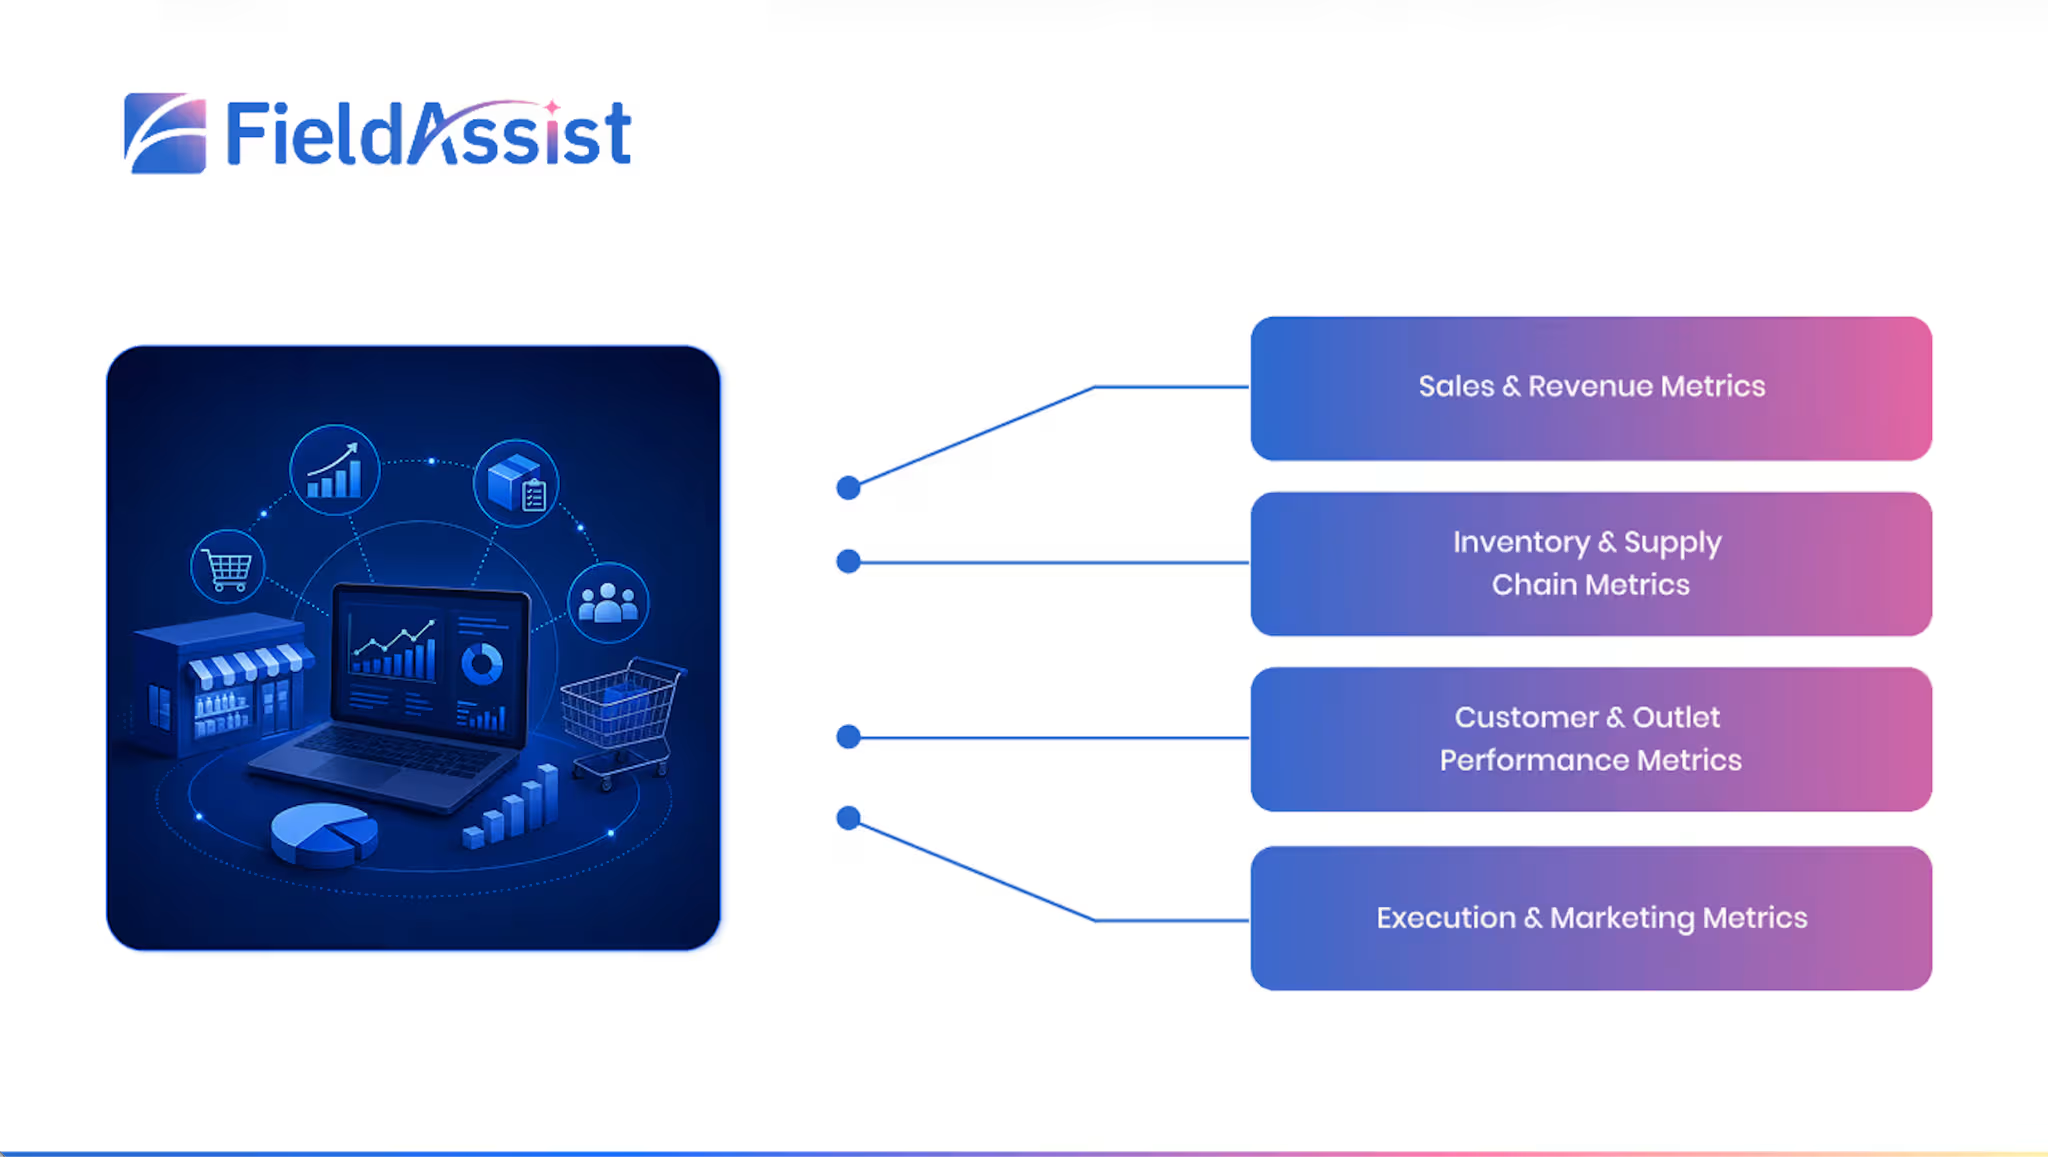
- Sales & Revenue Metrics: Primary and secondary sales, sell-through rates, average order value, revenue by territory, and SKU-level contribution to overall growth.
- Inventory & Supply Chain Metrics: Stock availability, days of inventory on hand, order fulfillment rates, and out-of-stock frequency. This category carries real financial weight.
IHL Group's global inventory distortion study found that out-of-stocks and overstocks cost the retail industry $1.73 trillion annually, equivalent to 6.5% of global retail sales, and that retailers deploying AI and machine learning in this area see 2.3 times higher sales growth and 2.5 times higher profit growth than those still relying on manual processes.
- Customer & Outlet Performance Metrics: Outlet segmentation, visit compliance, retailer profitability, and churn risk. Not every outlet contributes equally, and good analytics helps prioritize the ones that do.
- Execution & Marketing Metrics: Merchandising and planogram compliance, promotion ROI, in-store visibility scores, and field rep productivity. This is the layer where strategy either shows up on the shelf or quietly fails to.
How Can AI Improve Retail Analytics?
Traditional retail analytics required analysts to manually query data and build reports, useful, but slow, and limited to whatever questions someone thought to ask. AI retail analytics software
changes that equation by finding patterns, anomalies, and opportunities at a scale and speed no human team can match. McKinsey's analysis of retailers actively rewiring their organizations around AI found an average EBITDA increase of roughly 20 percent and a threefold return for every dollar invested, a strong signal of how much value stays untapped when analytics remains a manual, backward-looking exercise.
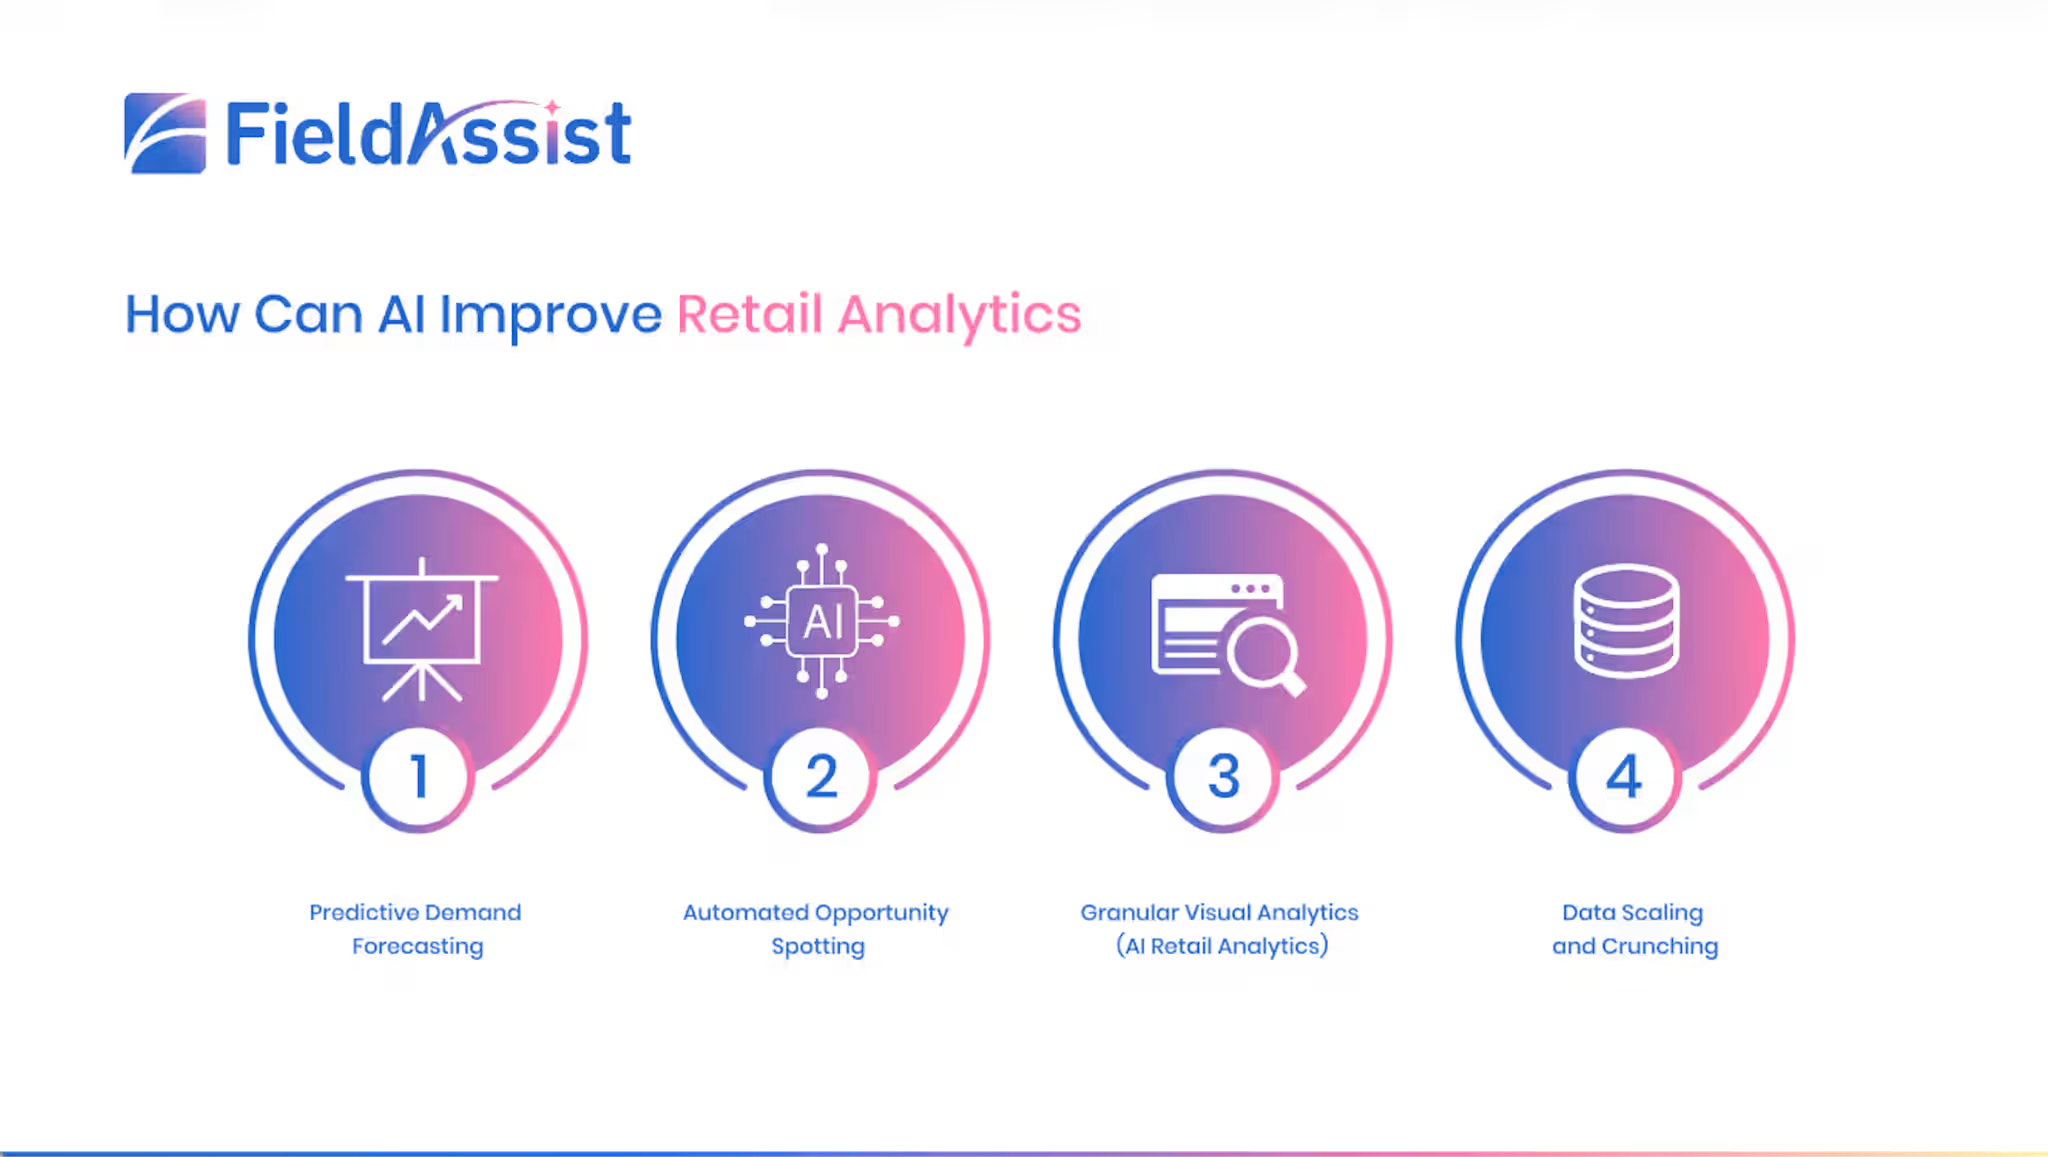
1. Predictive Demand Forecasting
AI models incorporate seasonality, local events, weather, and historical sell-through to forecast demand at the SKU-outlet level, dramatically reducing both stock-outs and costly overstocking.
2. Automated Opportunity Spotting
Instead of a sales director scrolling through dashboards looking for problems, AI surfaces them automatically: the distributor whose stock is about to run out, the outlet whose sales have quietly declined for three weeks running, the territory outperforming its target and ready for more supply.
3. Granular Visual Analytics (AI Retail Analytics)
Computer vision applied to shelf and outlet images can automatically assess planogram compliance, shelf share, and product visibility, data that used to require manual audits and was often outdated by the time it reached a decision-maker. This is AI retail analytics at its most tangible: turning a photo from a field rep's phone into a boardroom-ready compliance score within minutes.
4. Data Scaling and Crunching
CPG brands operating across thousands of outlets generate volumes of data that no human team could process in real time. AI-powered platforms can crunch this at scale continuously, refreshing insights daily or even hourly rather than in a monthly review cycle.
Choosing the Right Retail Analytics Software
With dozens of retail business intelligence tools on the market, CPG and FMCG leaders should evaluate options to choose the right retail analytics software.
Key features to look for:
- Field-to-boardroom connectivity: The software should connect front-line execution data (SFA, DMS, outlet visits) directly to leadership-level reporting, not treat them as separate systems that need manual reconciliation.
- Real-time refresh: Monthly reports are too slow for markets where a stock-out today is a lost sale today. Look for platforms built to refresh continuously.
- Built-in AI and decision intelligence: The platform should go beyond descriptive dashboards and actively recommend next-best actions.
- Scalability across geographies: For brands operating across urban, rural, and multi-country footprints, the software must handle outlet volumes, language, and connectivity variations without breaking down.
- Ease of adoption for field teams: The most sophisticated retail data analytics platform is worthless if the sales rep on the ground finds it too complex to use. Simplicity at the point of execution matters as much as depth at the point of analysis.
If you're benchmarking vendors, ask each one for concrete retail analytics examples from CPG or FMCG clients of a similar size and footprint to yours, not generic case studies from unrelated industries. The best retail analytics software such as FieldAssist’s will show a clear line from a data signal to a field action to a measurable sales outcome, not just a screenshot of a dashboard.
Conclusion
Retail data analytics has moved well past the era of static monthly reports. For CPG and FMCG sales leaders, the real competitive edge lies in closing the loop between insight and execution, turning descriptive dashboards into prescriptive, AI-powered recommendations that reach the field the same day a problem emerges.
Brands that treat analytics as a strategic, always-on capability, rather than a quarterly reporting exercise, are the ones closing the last-mile execution gap and converting data into consistent, on-shelf growth. Whatever stage your organization is at, the fundamentals covered in this retail data analytics guide are the right starting point for that journey.
Frequently Asked Questions
Q1: What is retail data analytics?
Retail data analytics is the process of collecting and analyzing data from sales, inventory, outlets, and field execution to guide faster, more accurate retail decisions, spanning descriptive, diagnostic, predictive, and prescriptive analysis.
Q2: What is the difference between retail analytics and traditional BI tools?
Traditional retail business intelligence tools are largely descriptive, they tell you what happened through dashboards and reports. Modern analytics goes further, incorporating predictive and prescriptive capabilities that forecast outcomes and recommend specific actions, often powered by AI.
Q3: How does real-time sales analytics improve field team execution?
Real-time analytics flags issues, a stock-out, a missed outlet visit, a declining territory, the moment they happen, rather than in a delayed monthly report. This lets field teams and sales directors act within the same day, preventing small execution gaps from quietly compounding into lost sales across an entire quarter.
Q4: What are the primary benefits of self-serve analytics for FMCG and CPG brands?
Self-serve analytics lets sales directors, regional managers, and field teams access relevant insights without waiting on a central analytics team, speeding up decision-making, improving adoption across the organization, and ensuring insights reach the people who can act on them fastest, whether that's a zonal head reviewing territory performance or a field rep checking outlet-level stock before a visit.




.avif)