


Table of Contents
ToggleThe importance of tracking retail metrics
Anil Khatri is a 2nd generation entrepreneur and runs a INR 400 crore manufacturing firm – one of the biggest suppliers of oats and wheat bran to food companies in India. 12 months ago, he decided to launch his own range of high-fibre biscuits, rolled oats, and granola in north India.
The first few months went into setting up a wider distribution network and expanding their reach across Delhi, Punjab, Chandigarh and U.P. Yet, Anil quickly realized that B2C selling is very different from B2B selling. Sales were not scaling up as much as he expected, and he was getting increasingly frustrated.
He reached out to an acquaintance, Mr Garg, the National Sales Head of a wafers company, and asked him, “I understand B2C has its own unique challenges but I’ve assessed how we operate. Our quality is at par with brands in the same segment, we’re present in the right outlets, we’re quite fair on our pricing, and we have hired competent salespeople. Then why aren’t our sales numbers growing quickly? What am I doing wrong?”
Mr Garg laughed and said, “Have you heard of the American Airlines olive story? They were looking for ways to streamline their expenses and improve profitability. By removing just one single olive from every salad served to passengers, the airline saved $100,000 a year. The devil is in the details, my friend.
You think you have a competent team, but do you know how many outlets are billing regularly out of the ones your boys visit every week? Your team is bringing in the orders, but do you know what is the number of categories or Lines Cut per Call they are selling? If you don’t track the right success retail metrics, knowing where you’re going wrong will always remain a grey area. The platform I use helps me get that drilled-down view of our numbers. That’s where you’ll also see the areas where you can improve your efficiency.”
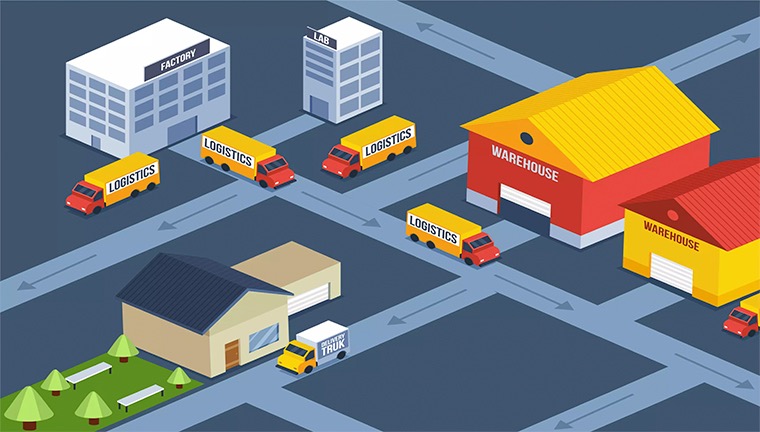
Over the next couple of months, Anil rolled out a sales and distribution platform that was scalable, agile and seemed almost custom-made for his industry. To start with, the customer success team helped him identify these eight retail metrics that measure performance in the field, amongst distributors, and among that he needed to track to fast-track his sales in kirana retail.

Tracking Field Performance
Daily Retail Time
This is the number of hours a sales agent spends on the field daily day visiting retail outlets in his beat. In the CPG industry, a salesperson typically spends about 7-8 retailing hours in the market, usually starting the day around 10 am.
Earlier, Anil knew that his people are in the field till 4 pm. The South Delhi salesmen had a daily target of visiting 32 outlets; for North Delhi, it was 30.
Daily Retail Time = Time spent from 1st call to last call
His technology partner helped him understand that the industry average for the number of outlets visited in a day is between 38-40, and the industry average spent at an outlet was about 9 minutes. This meant that Anil’s sales agents as well as outlet potential were being underutilized.
With data coming in live from the field via automation, Anil streamlined his sales operations, and increased visits between 32-38 targets depending on the territory. Transparent data insights like these from the sales force automation platform helped him make better business decisions and improve market penetration.
Strike Rate
This is the proportion of Productive Calls out of the Total Calls made in a day.
Strike Rate = (Number of outlets that placed an order/ Total calls made)*100
If your strike rate is 60% or lower, you should drill down details on the shop-type, geography, no-sale reason etc. to get deeper insights and take corrective action.
For Anil’s sales agents, the focus used to be the total value of orders booked – rather than the number of orders captured. He discovered that in one beat, only 8 out of 28 outlets placed an order. That was a strike rate of only 28%! Deploying SFA helped Anil see these glaring red flags for the outlets that weren’t ordering, and then take specific mitigating measures.
Sales Target vs Achievement
This is a metric that tracks individual sales performance. Each member of the on-ground field force carries a monthly sales target – based on the size of the business, the company’s market share, outlet penetration, and overall business goals. A salesperson can have both revenue-wise and category-wise targets.
Sales agent’s Target Achievement = (Revenue achievement/Revenue Target + Category achievement/Category target)*100
For example: A sales officer had a monthly target of INR 5 lakh revenue and 100 cases of the newly launched granola bars. With automation, he could view the target achievement and progress of every salesperson in real time. The data also enabled him to identify the ‘high performers’ (to recognize and reward) and the bottom 15-20% (to identify training interventions).

Tracking Distributor Performance
Fulfilment Rate
It is the number of retailer orders that a distributor is able to fulfil completely within a defined amount of time.
Fulfilment Rate = (No of orders entirely fulfilled/Total orders received)*100
Sometimes, if a distributor doesn’t possess sufficient stock of the SKUs ordered, he might fulfil the order partially. And on a few occasions, if he is completely out of stock, he might have to cancel an order completely.
With a Distributor Management system integrated with his Sales Force Automation system, Anil was able to see that the Fulfilment Rate from his North Delhi distributor was almost 90%, but it was below 80% for the Dwarka distributor.
As it turned out, the reason for the lower rate for the latter was that he didn’t want to spend too much (and thus lock his liquidity) in Anil’s products because the margins that his company gave him weren’t high enough! Thanks to this important insight from his automation solution, Anil was able to identify the root cause of the low fulfilment rate in no time.
Collections, Outstanding, and Ledger
These are the numbers against each distributor that show their financial prowess: How quickly they are collecting money from the market, how much they are liquidating in the market, what is his total outstanding in the market from retailers, and much more.
With DMS, sales leaders of brands can view and analyze these numbers against every distributor, and gauge which partner can be pushed or incentivized to carry more inventory, or to rotate their inventory faster.
Demand capture
This metric captures all demand that a distributor receives from the market. In most cases, the company or the distributor’s own salesperson relays retailer orders to the distributor daily. But distributors often receive orders directly from retailers, either because they have a good relationship with the distributor or due to the unavailability of the company salesperson.
Total Orders Received by Distributor = Orders via SFA + Direct Orders
With demand capture from direct orders as well as SFA orders captured on the same screen, Anil’s sales leaders made sure that demand capturing did not stop even if a salesman missed his beat.

Tracking Outlet Performance
Product Line Sold (Range Selling)
This is the number of different product categories a salesman is responsible for selling.
Number of categories punched per visit (out of the total number of categories stocked by that outlet)
Anil’s company had three major product categories: digestive biscuits, rolled oats, and granola – all in different flavours. Since the company launched digestives and rolled oats together, the sales agents had built good business for the biscuits. When the granola bars were launched later, they didn’t push the category hard enough, because there was already huge demand for the biscuits and the sales volume stayed strong.
Anil understood that he was in danger of depending on one single category for 80% of his total sales. He needed to hedge his risk and promote other products more to have a broader market presence.
Outlet-wise sales targets and Category-wise targets
Sales leaders make revenue projections for each outlet based on factors such as territory (Tier 1/Tier 2/Tier 3 cities), shop type (small kirana store, Modern Trade store (MT), Standalone MT, and so on), and market potential.
Outlet-wise performance = Maximum order from the outlet + Targeted Lines Cut
Anil had given both outlet-level targets and category-level targets to his team, but he had not been aggressively tracking category-level performance. Now with such detailed visibility of data on his automation platform, he had numbers like MTD (Month Till Date), Month-wise Target Vs Achievement rates and many others at his fingertips.
Anil couldn’t believe that an end-to-end integrated solution could open up so many actionable insights and possibilities for scaling up sales, improving ROI, and crafting a successful GTM strategy with authenticated performance numbers.
If you too are struggling to ramp up your brand like Anil, don’t waste another minute! Contact us today!
About Post Author
Divir Tiwari
A technology enthusiast at heart, Divir loves a good challenge. What he enjoys, even more, is finding out if it can possibly be solved with technology. He is the heart of the Sales Team at FieldAssist and is a business development magician. Divir is a firm believer in collective organisational growth, product-based solutions and adding value to customers’ business.