

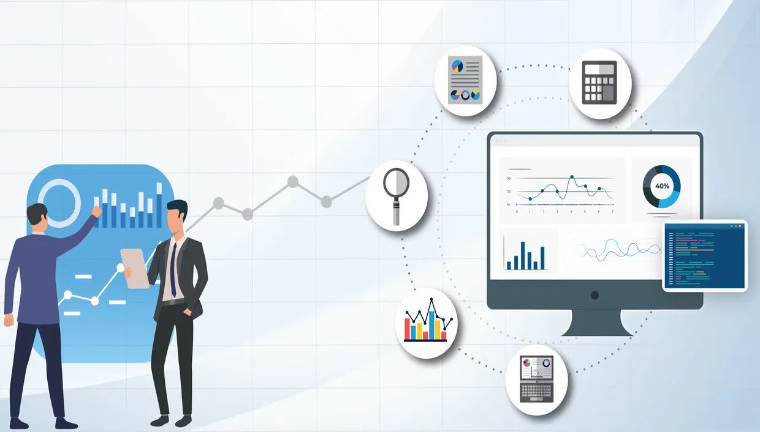

You may want to take real-time decisions in the field but without easy-to-read infographics, you may never find data exceptions and your efficiency will suffer.
Now accomplish more with easy-to-understand graphs and charts on the go with our sales visualization tool.

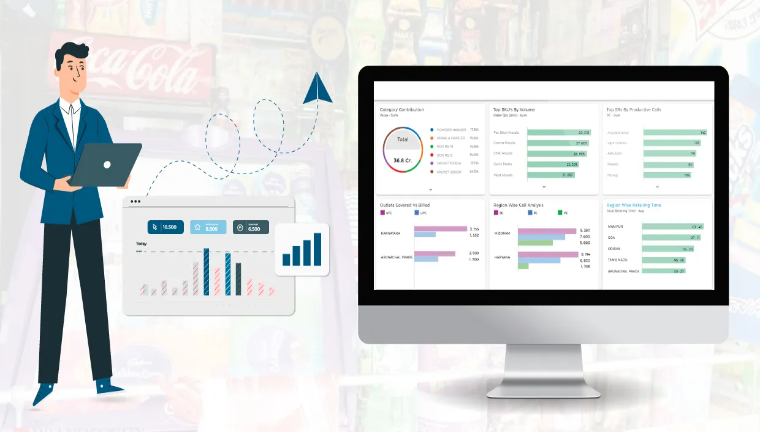
Instead of seeing a standard template, a Personalized Dashboard offers crisp, collated view of specific data patterns based on parameters that you choose to see
More than 50 standard FMCG KPIs are available to make your own KPI combinations
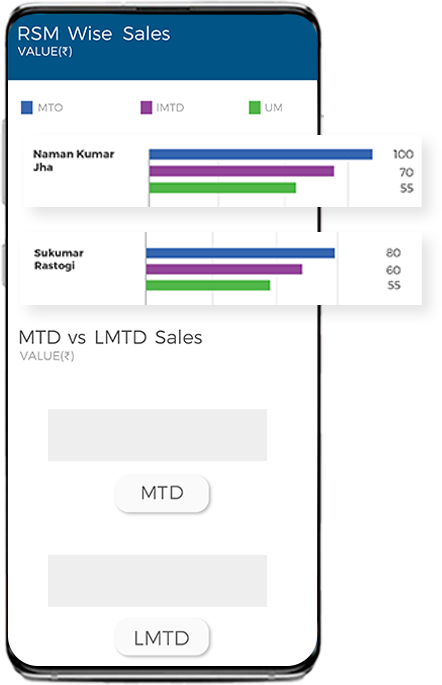
‘Last 3 months’, ‘Month on Month’ as well as ‘Last Month’ Graphical Charts can be created around reports to easily decipher data patterns and gaps in the performance on key KPIs.
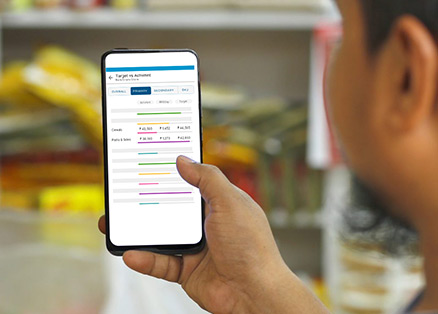
Take real time decisions with easy-to-read charts available on the mobile anytime, anywhere.
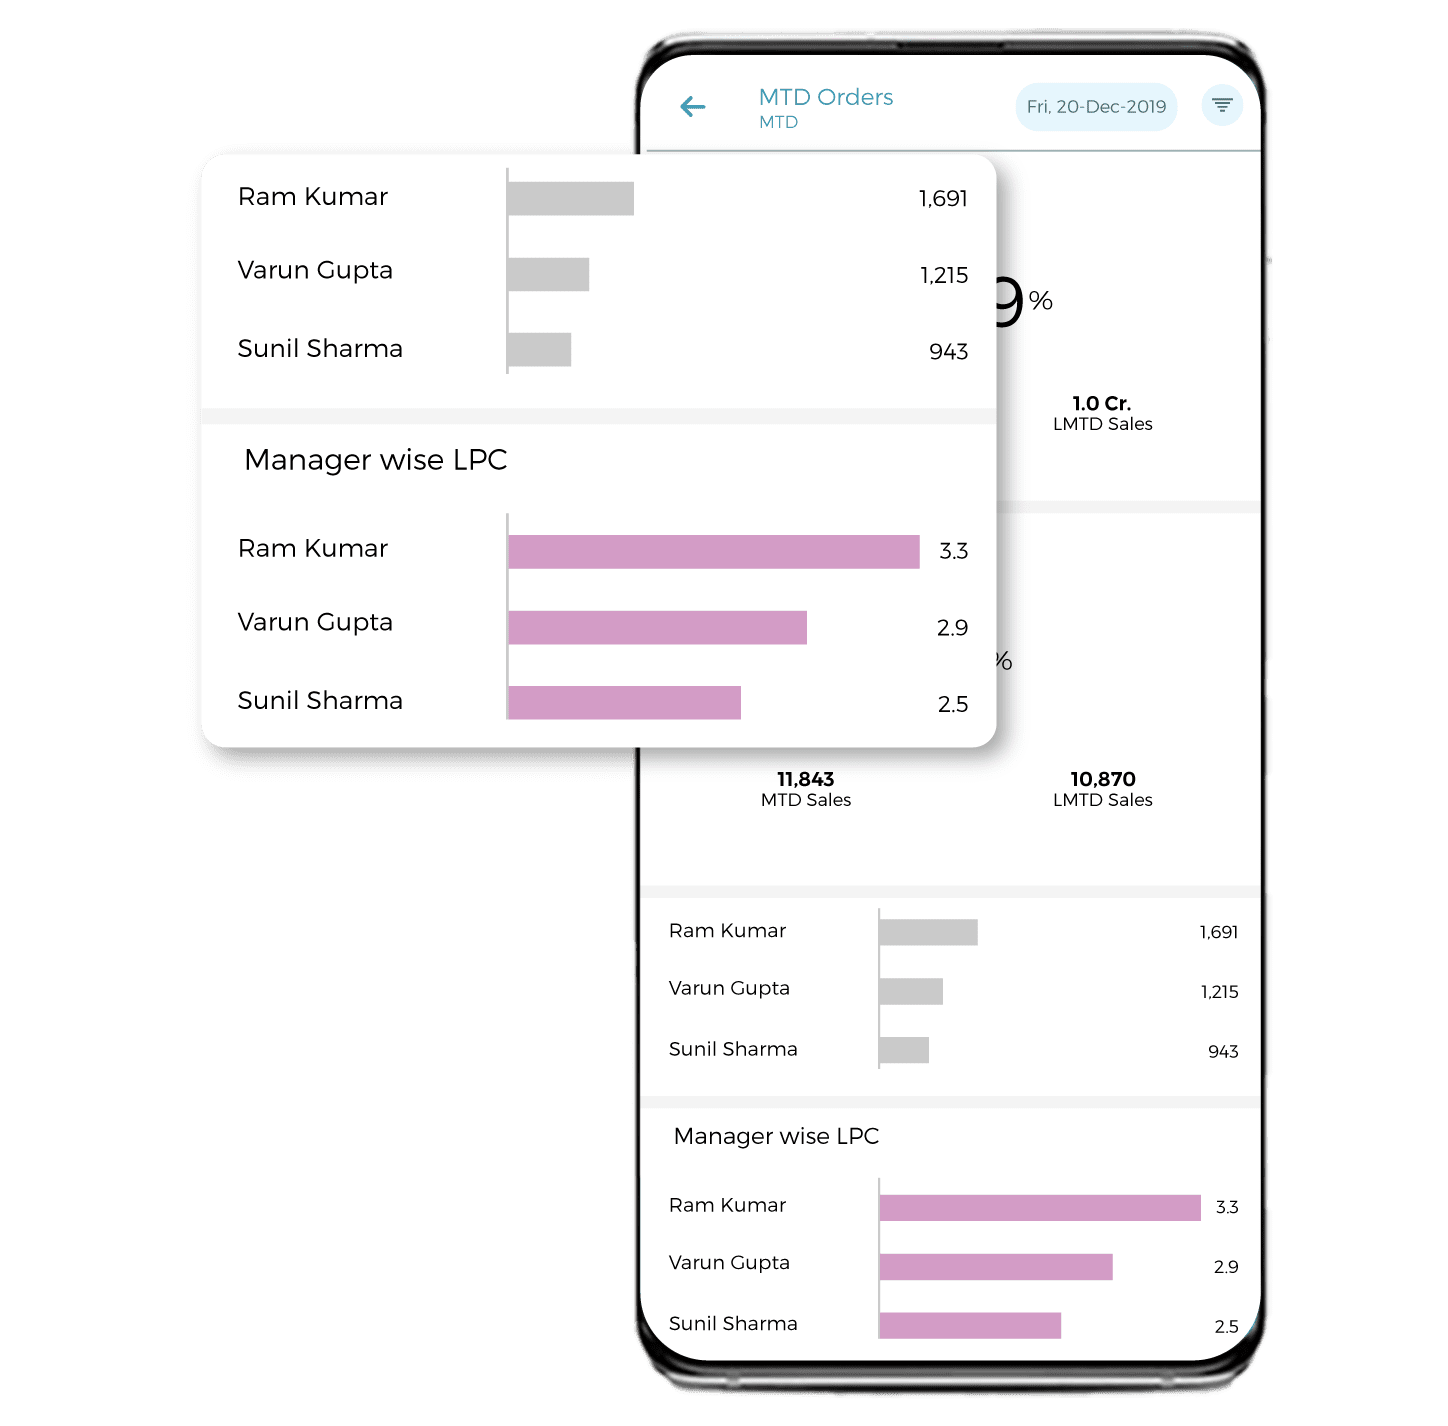
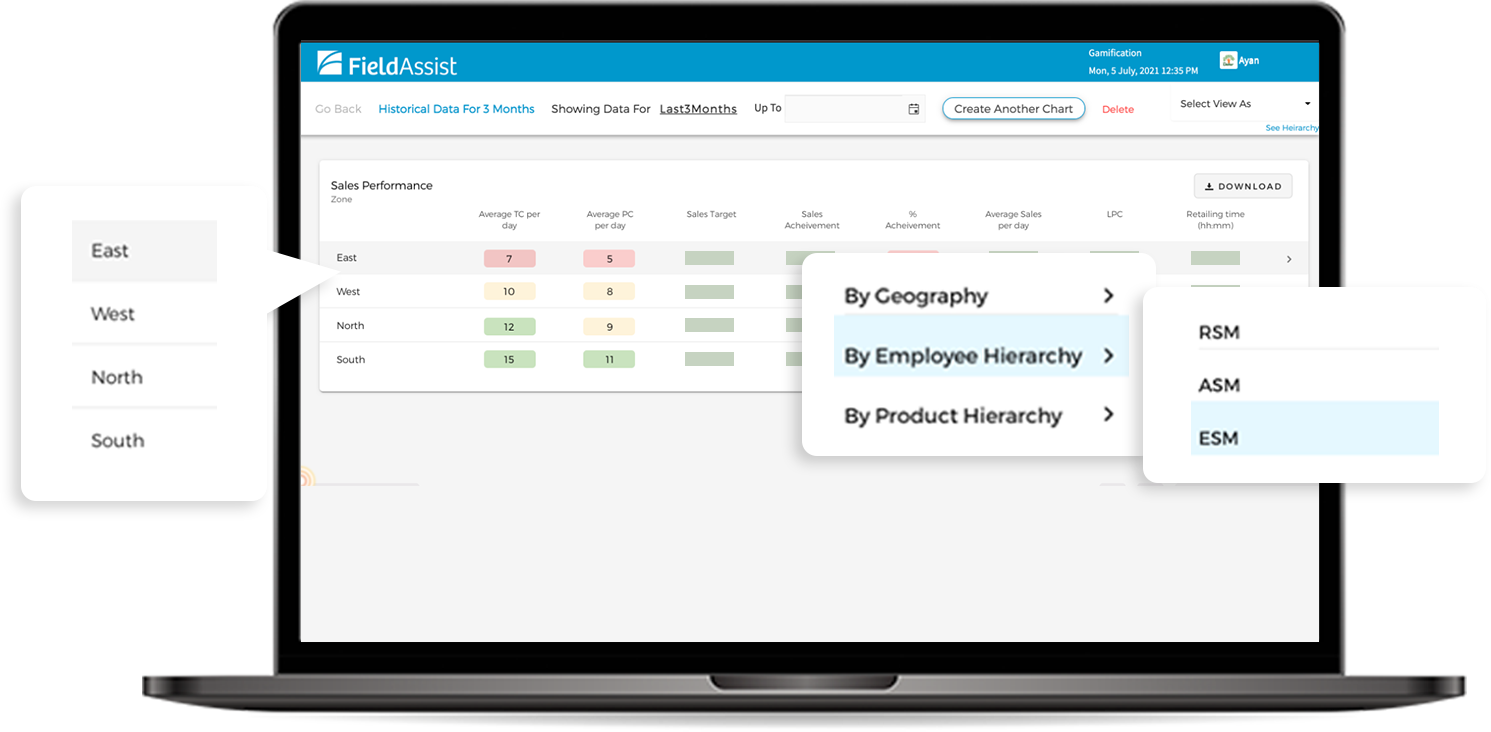
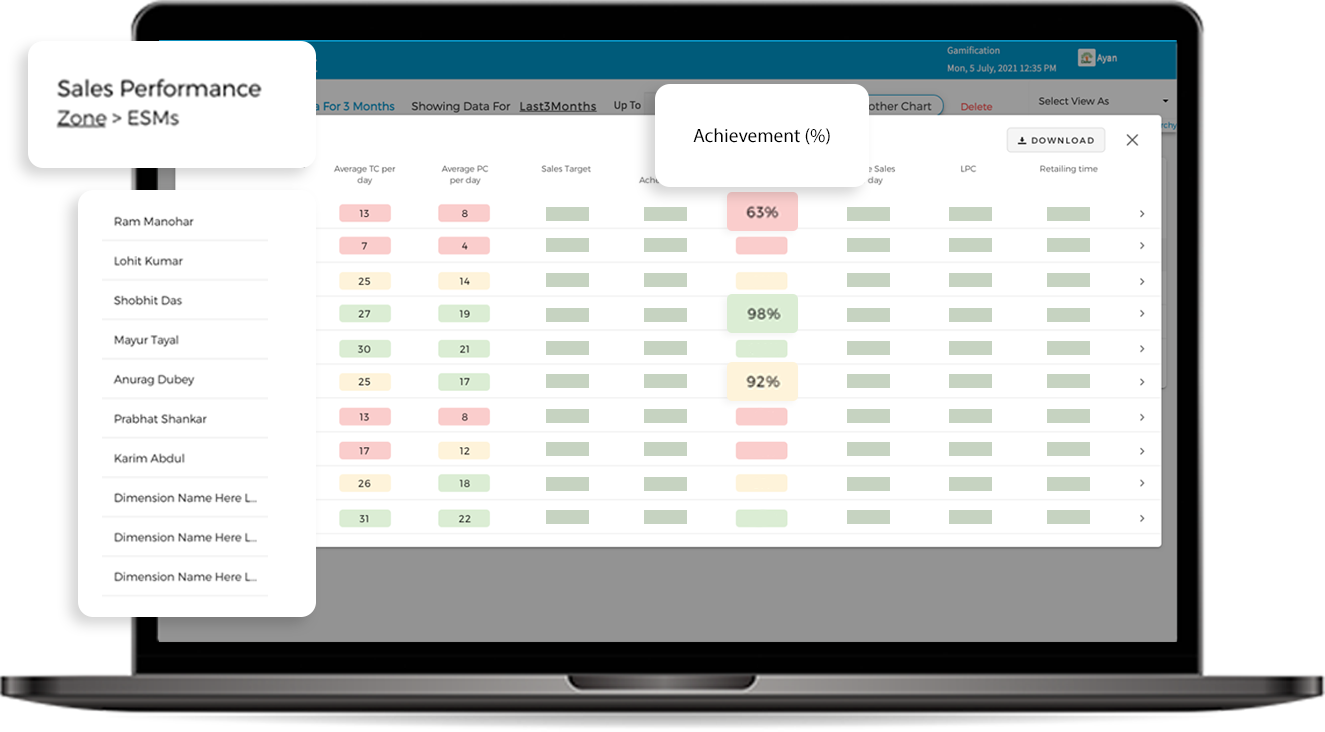
See highlighted and colour coded Exceptions in your data patterns to achieve depth of data by finding the root cause of those anomalies.
From established industry leaders to young startups, 600+ brands believe in us.
FieldAssist is a SaaS based technology platform transforming route-to-market capabilities of CPG companies across the value-chain.

© Copyright 2024 Flick2Know Technologies Pvt. Ltd.