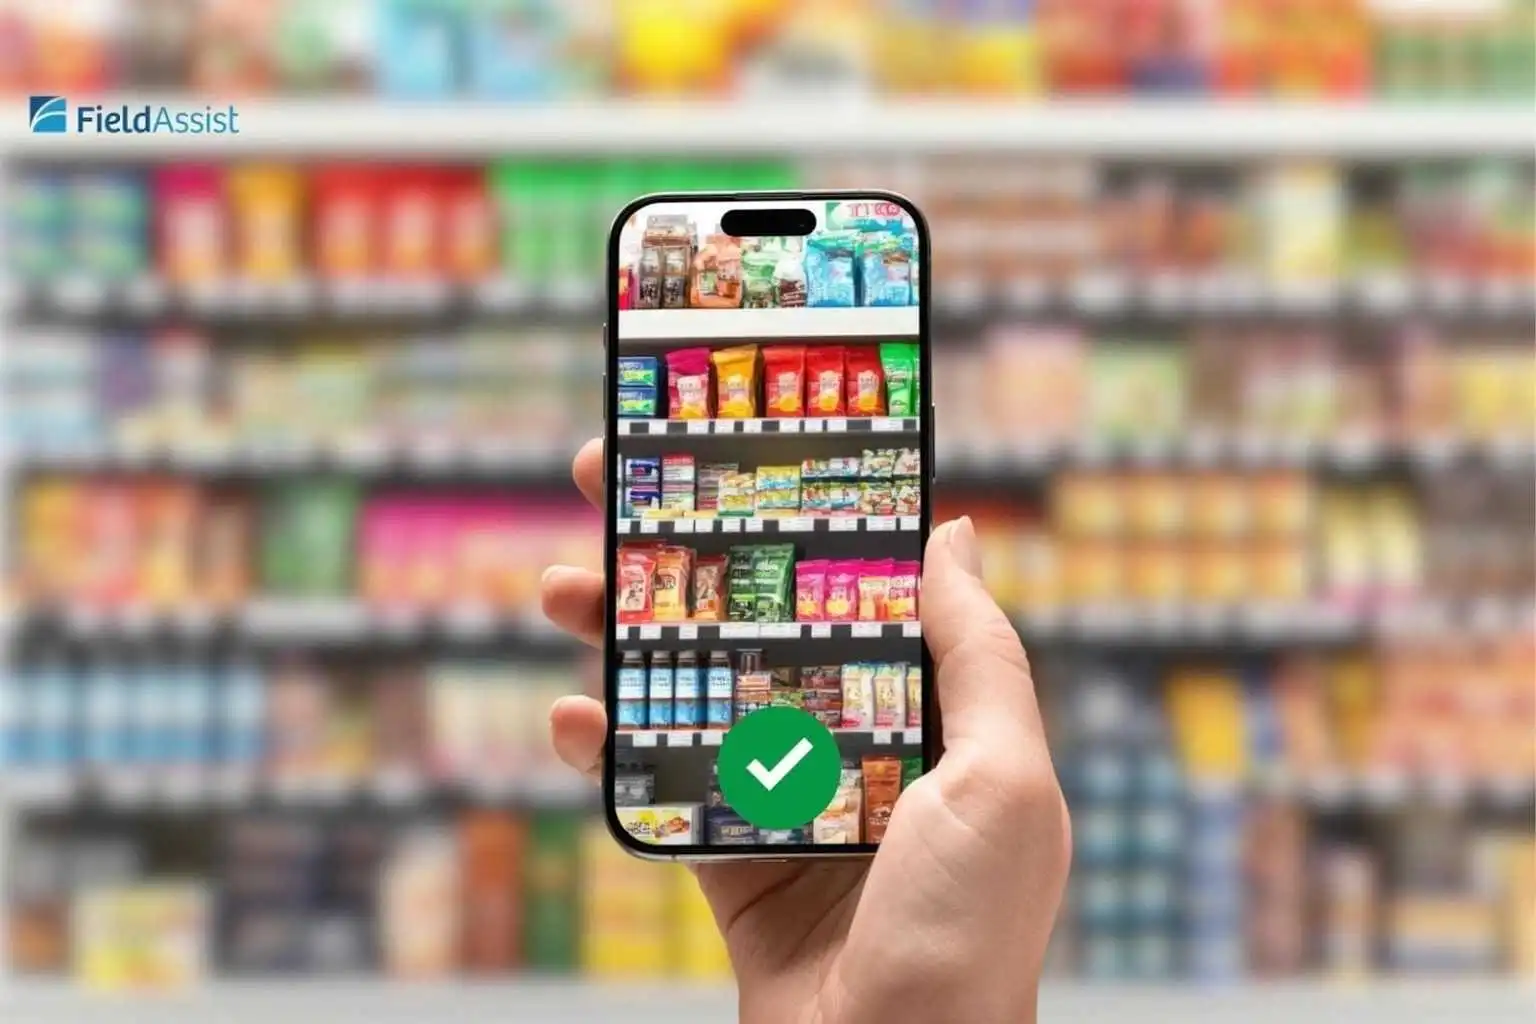
Turn Data into Decisions with Retail Analytics Software Solutions
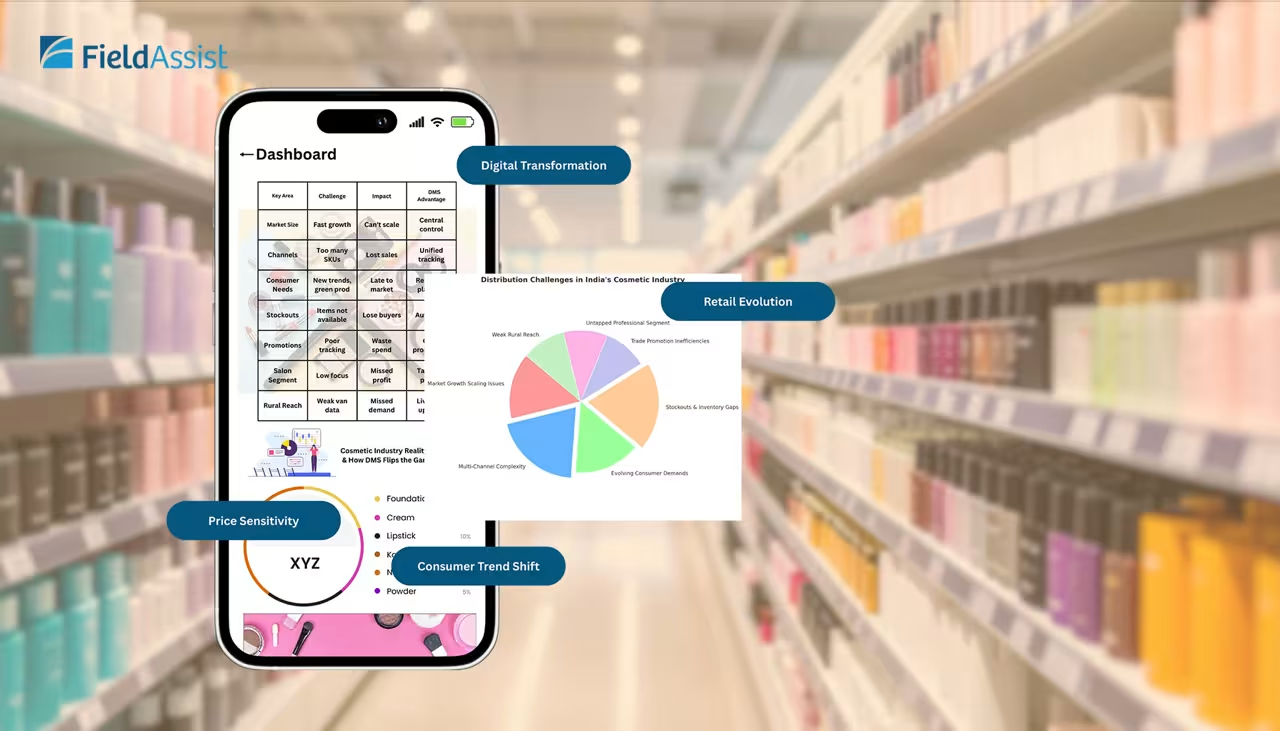
FA Analytics Studio is a next-gen sales analytics software and custom reporting dashboard built for FMCG and CPG businesses. With unified views from SFA and DMS, FA Analytics Studio helps brands accelerate reporting speed, improve decision visibility, and act on insights instantly via a self-serve analytics tool that scales with real-time performance data.
32
+
8
.9mn
190
K
75
K
$
23
.6bn


Business Benefits of AI Sales Reporting and Analytics Software
One of the biggest advantages of using FA Analytics Studio is the ability to replace disconnected reports with a single, intelligent view. Brands using this AI-enabled analytics software gained agility in decision-making, visibility, and measurable growth impact.
Faster Decisions
Deep AI Visibility
AI Forecasting
Reduced IT Dependency
Scalable Performance
Improved ROI
Capabilities of FA Analytics Studio
FA Analytics Studio brings together intelligence, speed, and scale to transform how FMCG leaders analyze and act on sales and distribution data.
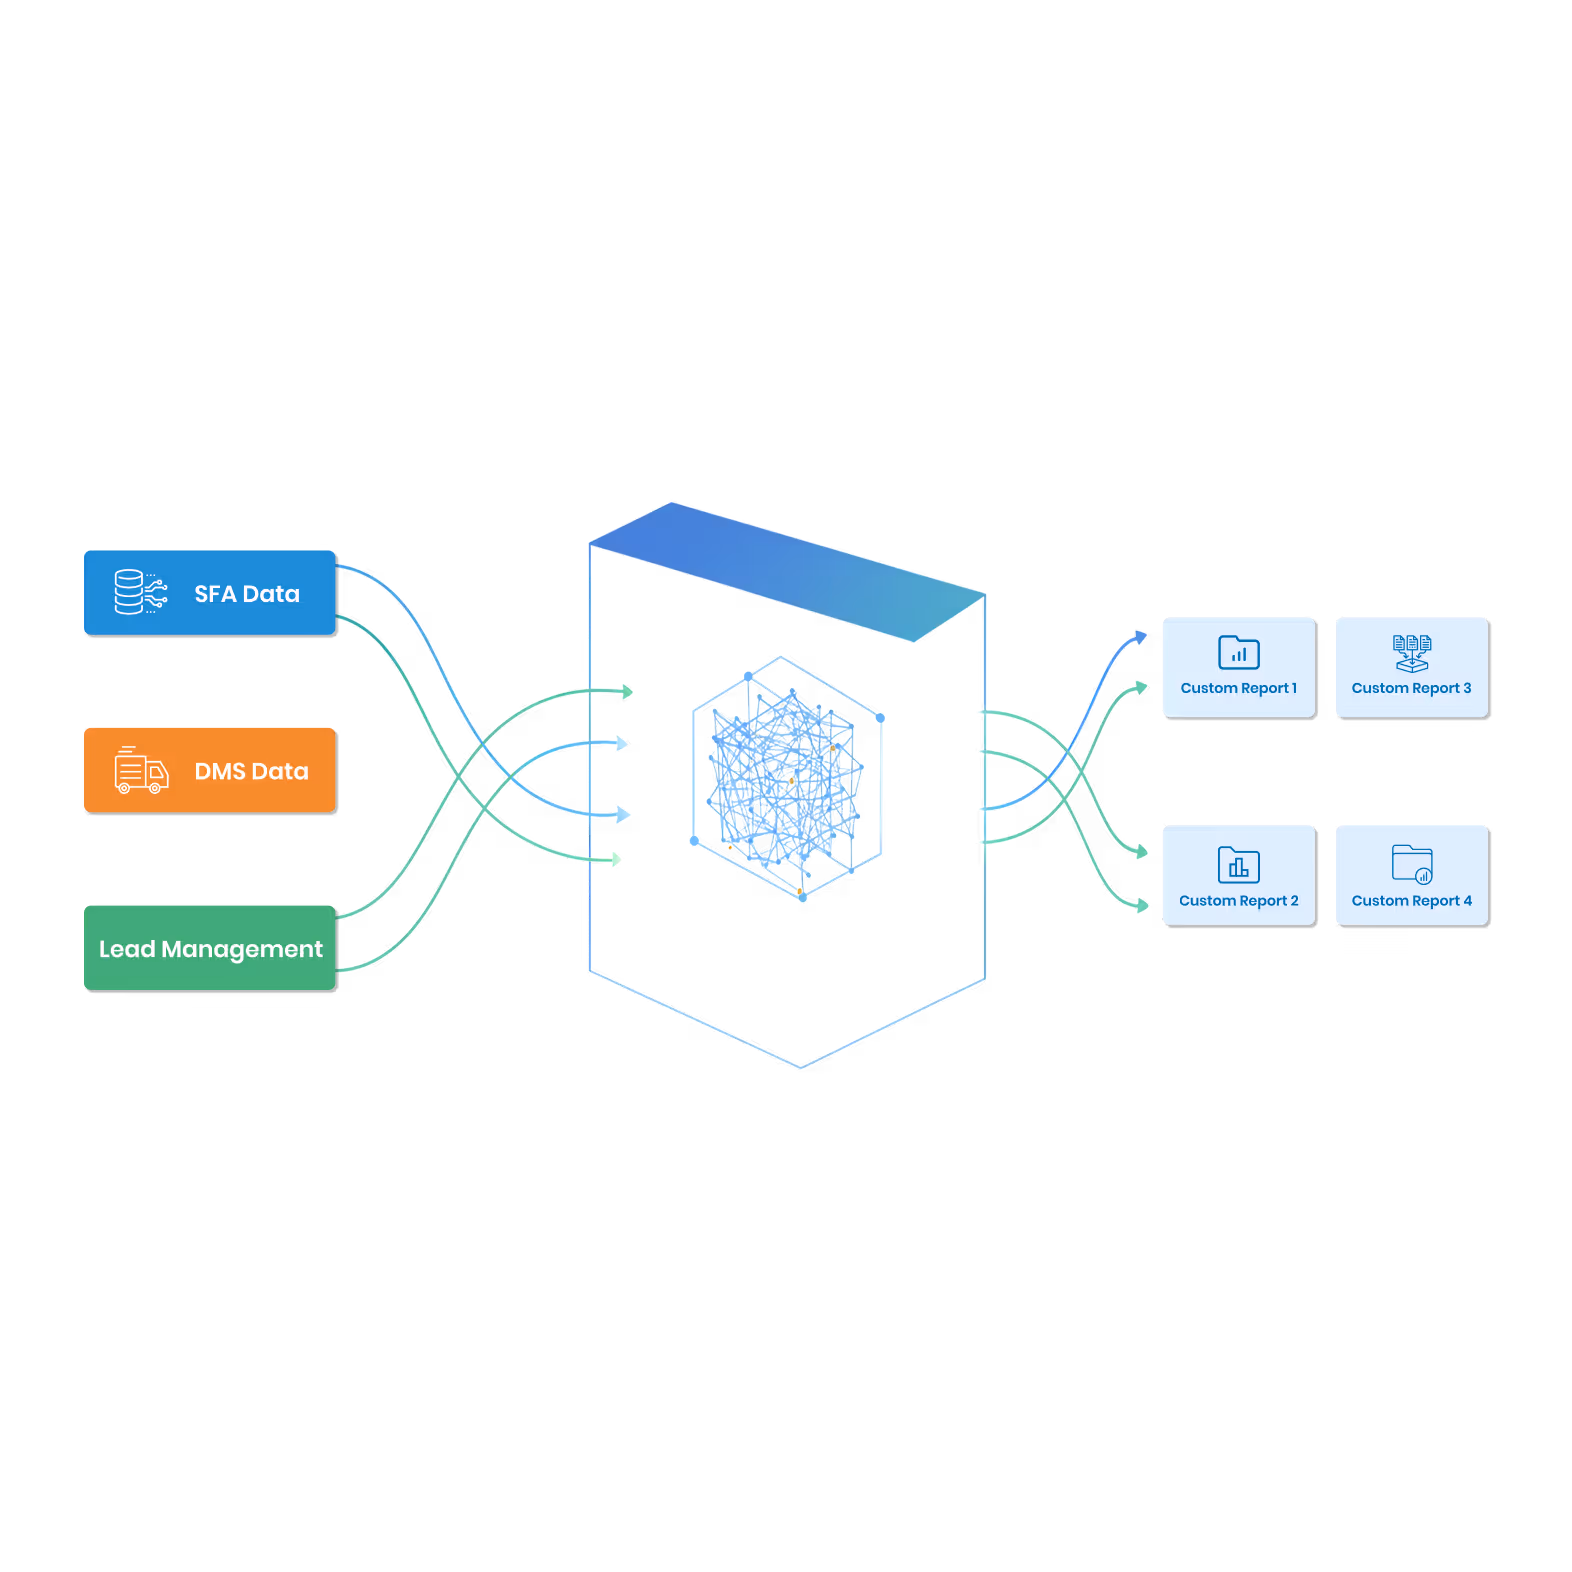
Unified Intelligence Layer
Combines SFA and DMS into one intelligent reporting platform.
Eliminates silos between field execution and distributor data.
Provides outlet-level insights with complete accuracy.
Builds a 360° view of sales and distribution insights.
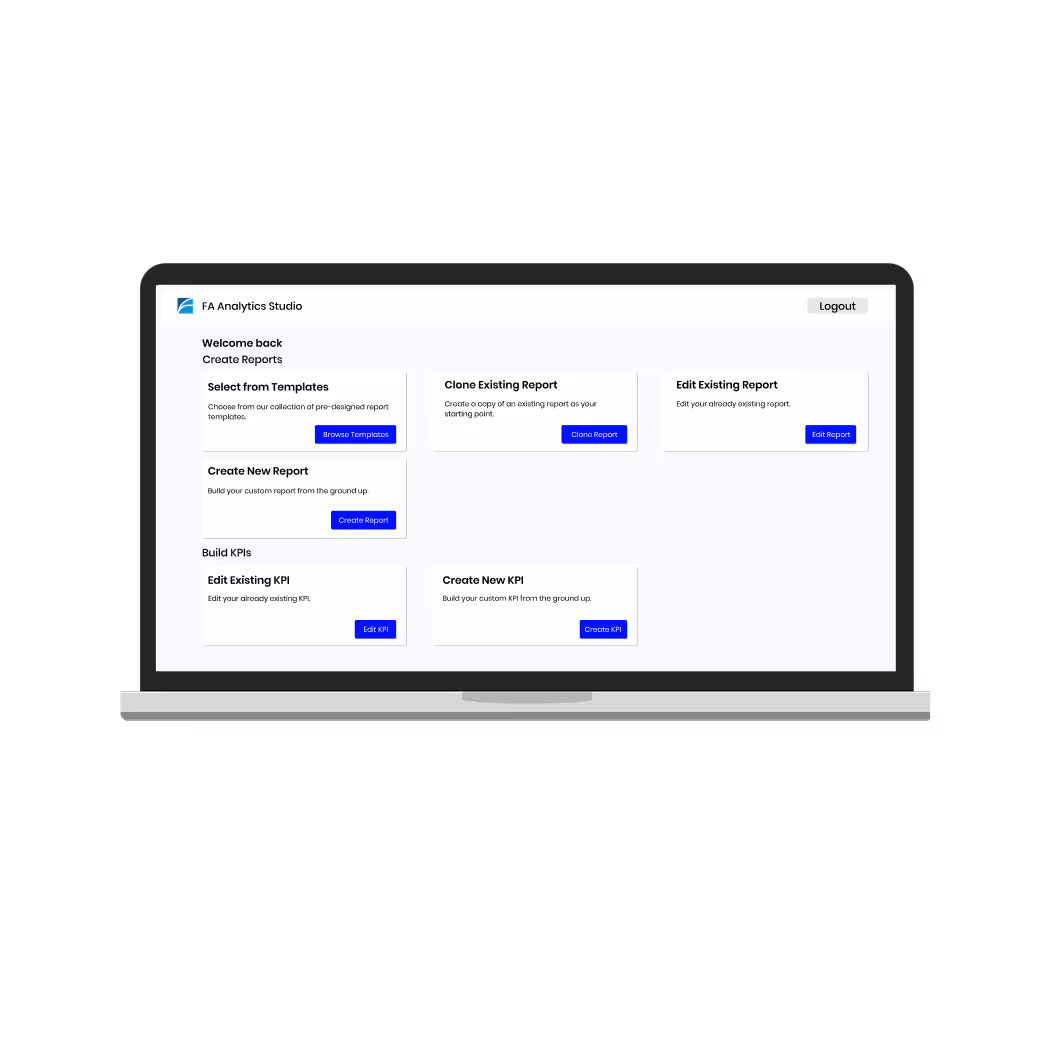
Self-Serve Analytics
Empower managers with custom reporting without IT dependency.
Role-based dashboards tailored for leadership, sales, and operations.
Create ad-hoc reports on demand with no coding.
Preview data instantly before final download.
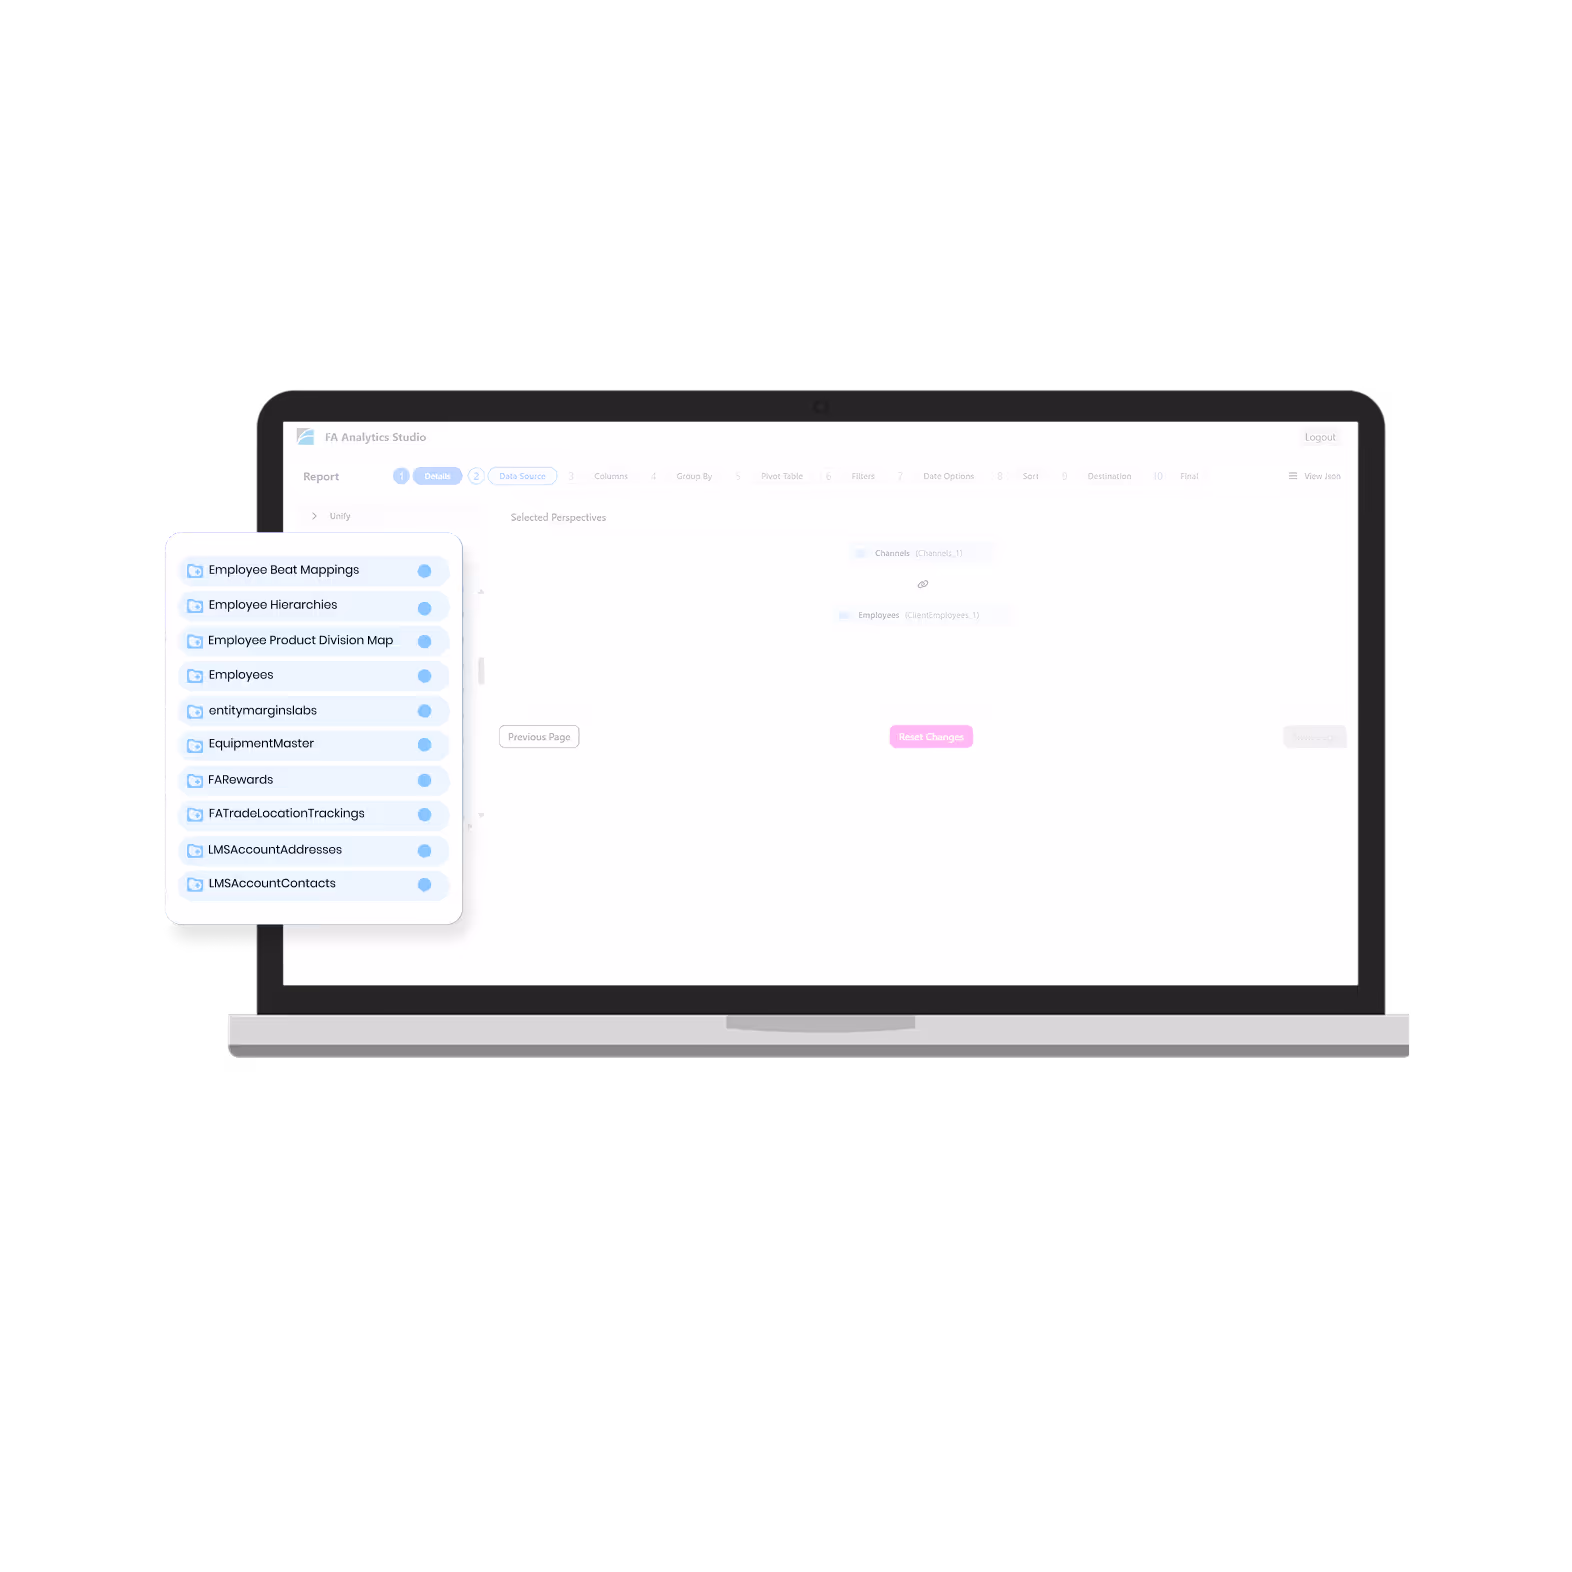
Smart Joins & Customization
Join multiple datasets seamlessly for deeper analysis.
Add custom columns to track business-specific KPIs.
Reuse templates across reports for consistency.
Save time with drag-and-drop customization.
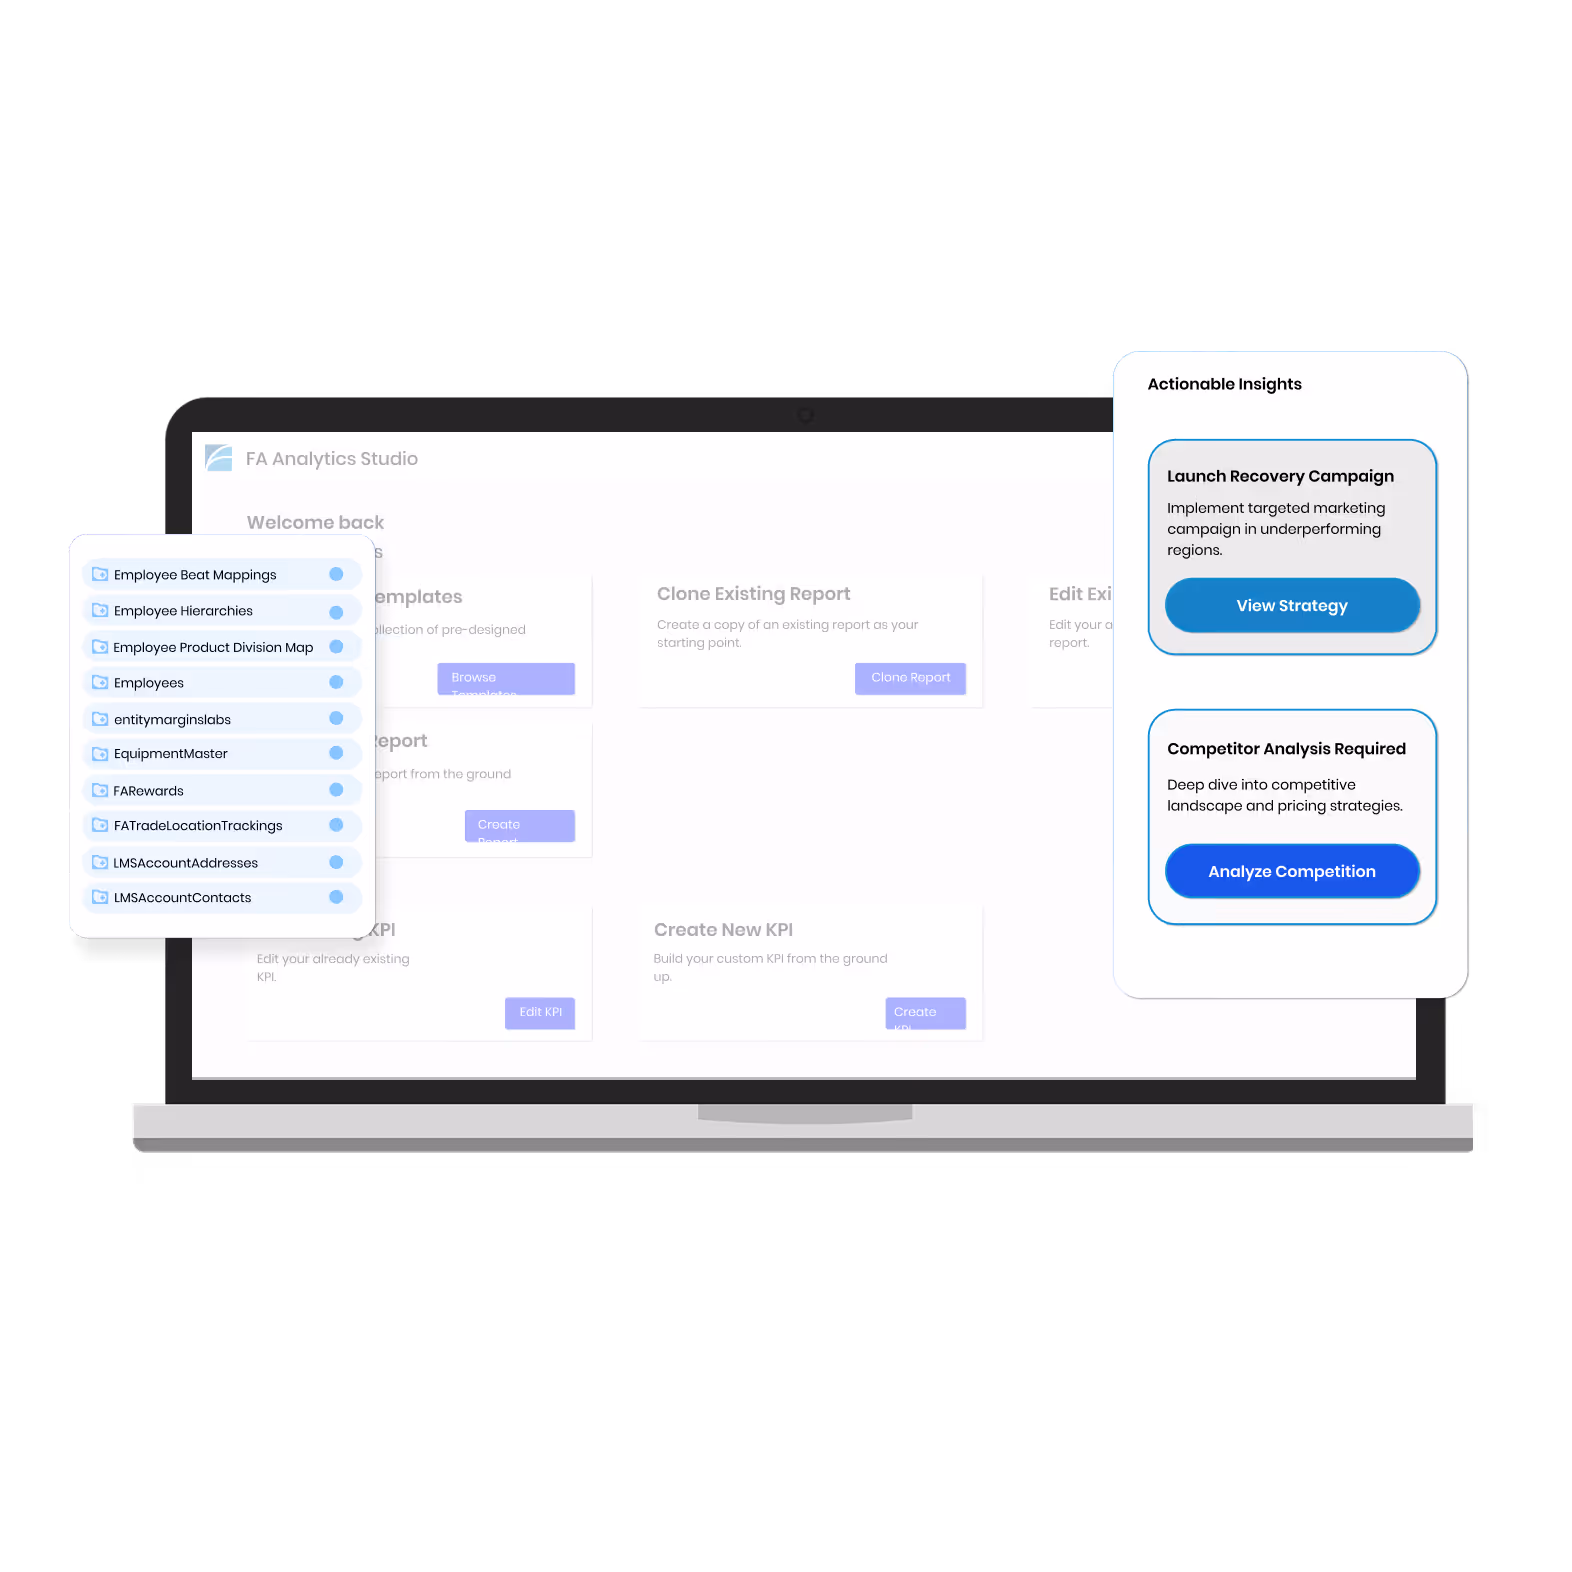
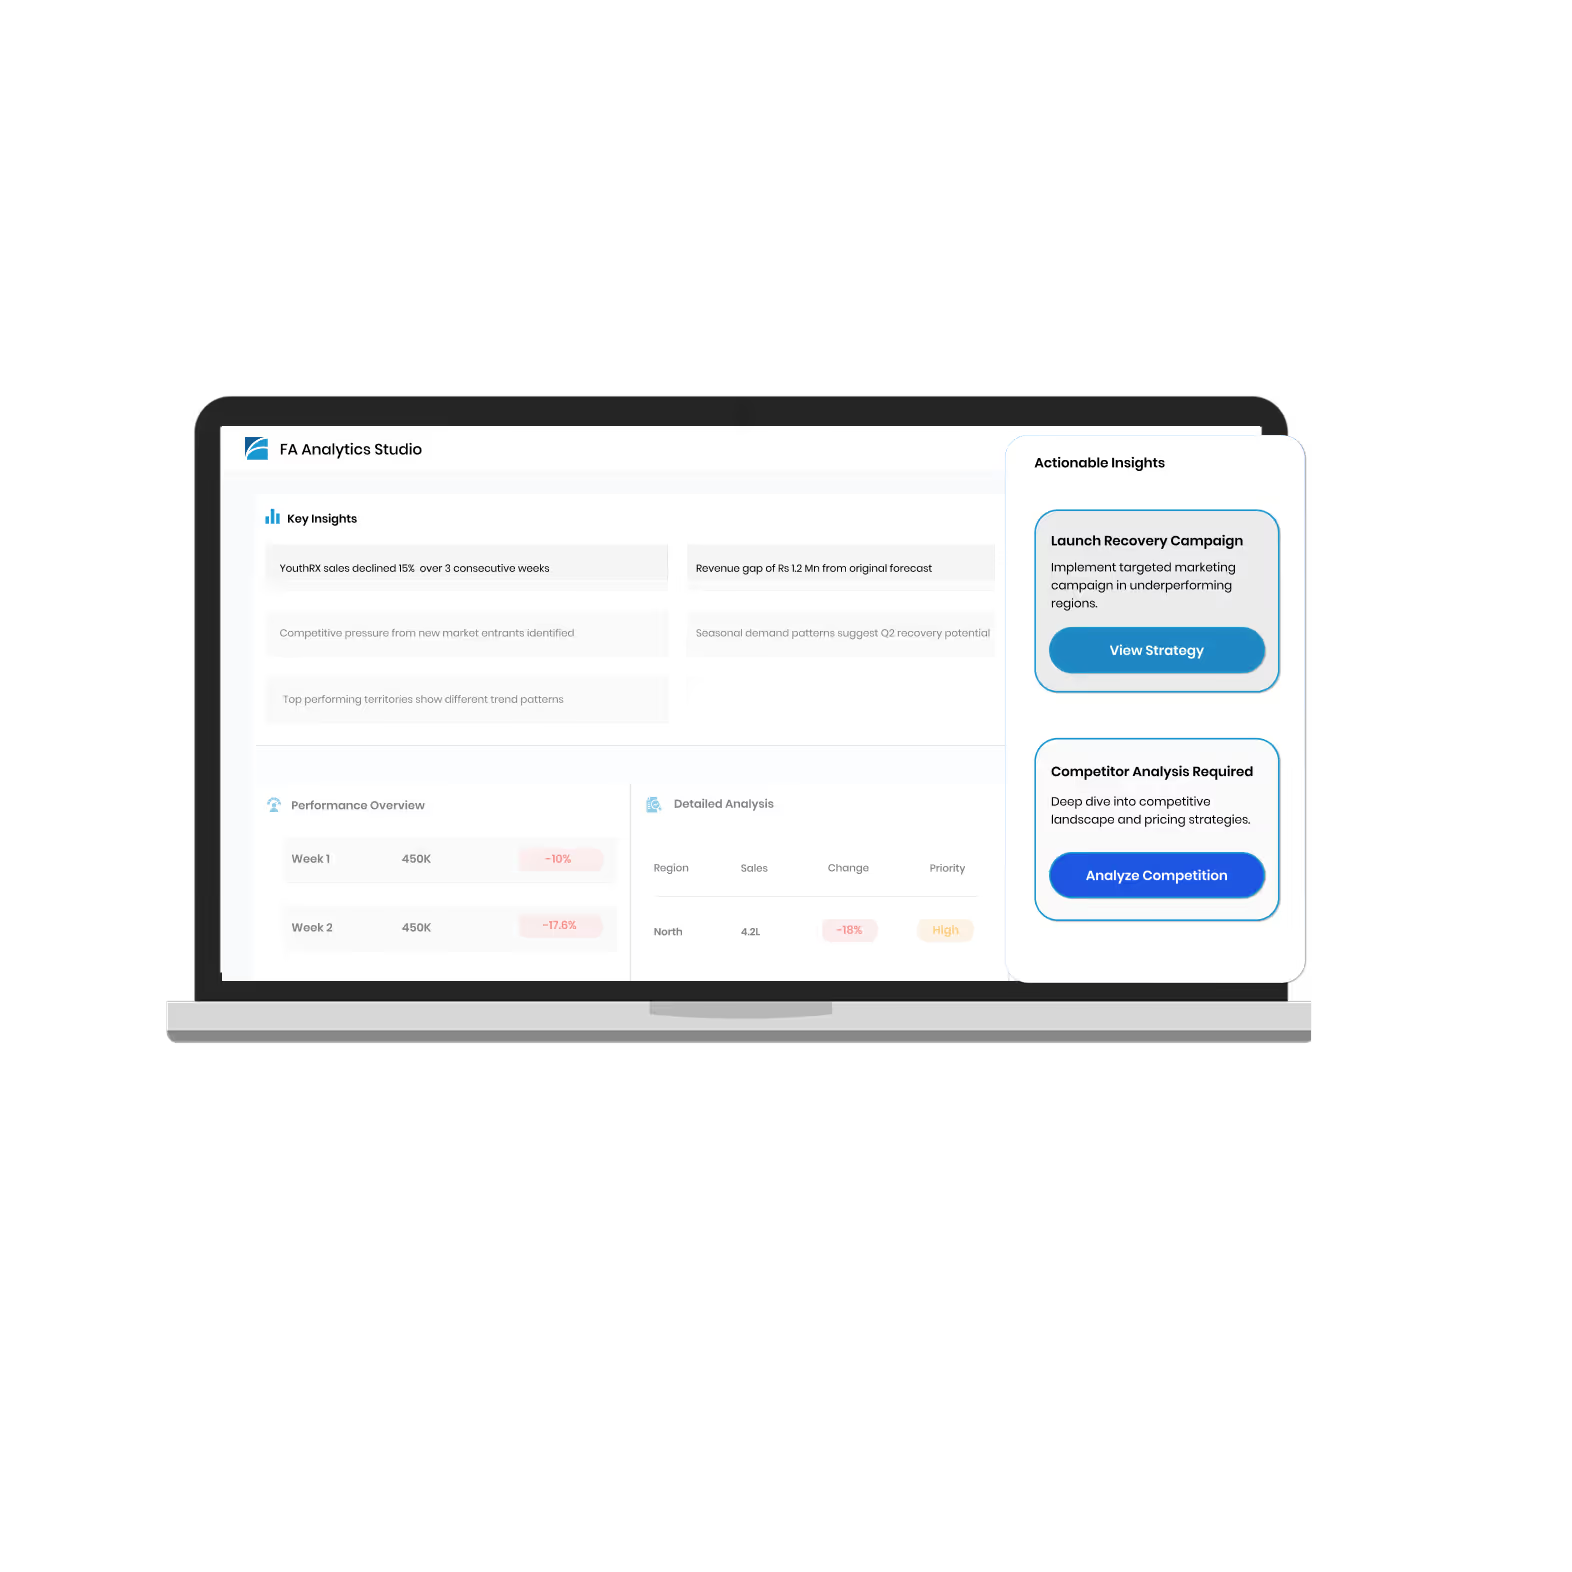
Actionable Insights
AI-powered analytics for demand forecasting and opportunity spotting.
Identify revenue leaks and distribution inefficiencies instantly.
Link insights directly to field execution and supply chain.
Drive measurable growth through smarter decisions.
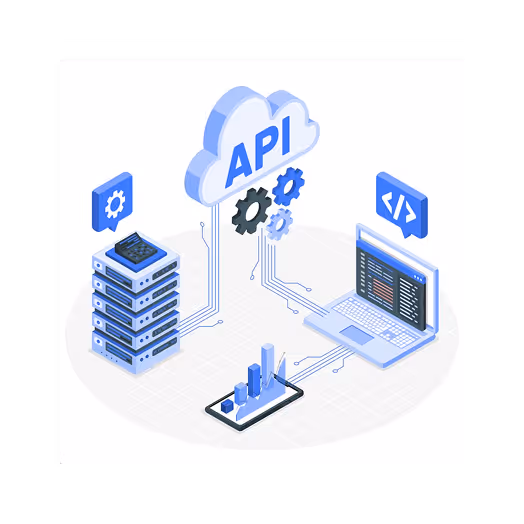
Scalable + API-Ready
Designed for national and multi-market deployments.
API-friendly integration with ERP, CRM, and BI systems.
Enterprise-grade performance during peak data crunches.
Download up to 500K rows in under 10 minutes.
Make Retail Intelligence Truly Actionable
FA Analytics Studio becomes even stronger when you connect it with other FieldAssist solutions. Together, they turn your daily sales data into clear, real-time actions that boost sales growth and efficiency.
Agentic AI that reasons, acts, and resolves
Experience the difference when AI takes ownership of outcomes, delivering bird’s-eye market clarity for sharper execution.
Integrates with all your favorite sales and distribution tools
Whether managing 100 or 1000 reps, FieldAssist integrates perfectly across your sales stack to eliminate leakages, expand outlet reach, and drive data-backed fulfillment.
Make Every Outlet Count For Growth with FieldAssist
The future belongs to brands that move faster, think smarter, and execute with absolute clarity.

Real Stories.
Real Transformation.
From digitizing distribution to optimizing market expansion, learn it all here.
Explore What's New, Useful & Interesting


.avif)


Take Delays Out of Reporting. Lead with Intelligence
With self-serve reporting, unified views, and AI-powered forecasting, your sales teams stop waiting for answers and start driving outcomes.
Frequently Asked Questions
FA Analytics Studio is a real-time, no-code sales analytics software and custom reporting platform for FMCG and CPG brands. It unifies SFA and DMS data, delivers real-time dashboards, and enables faster, smarter business decisions.
Some of the benefits of having a real-time sales and distribution intelligence includes:
- Empowers managers to make fast, data-backed decisions
- Reduces dependency on IT and MIS teams
- Enables role-wise insights at outlet, SKU, rep, and zone levels
- Speeds up report creation and download by 2x–3x
- Encourages KPI ownership across sales and supply functions
FieldAssist with AI is taking sales and distribution to the next level, beyond just automation into an intelligent, predictive, agentic execution. With AI, it becomes possible for managers and business stakeholders to forecast demand, recommend smarter routes, auto-replenish stock, and provide smart nudges to act in real time.
In short, by combining the 3i framework, we enable leaders to build a future-ready ecosystem.
FA Studio helps FMCG companies by reducing reporting delays, giving 360° visibility, and enabling faster decisions. It connects distributor data, retail execution, and outlet-level performance into one reporting platform, helping businesses:
- Anticipate demand shifts with AI forecasting.
- Improve execution by linking insights with field activity
- Strengthen distributor partnerships with accurate visibility.
FA Analytics Studio lets you build custom, goal-oriented reports tailored to sales, supply chain, trade marketing, and execution teams.
- Territory-wise sales and outlet coverage reports
- SKU-wise order, fill rate, and movement analysis
- Daily, weekly, and monthly productivity dashboards by rep or zone
- Beat adherence, PJP tracking, and call compliance reports
- Promotion and scheme performance by geography or product
- Dispatch vs. demand vs. billing reconciliation reports
- Dormant outlet tracking and churn risk heatmaps
- Van sales, rural GT, and channel-wise sales comparisons
Traditional BI tools are generic and require technical know-how. FA Analytics Studio is explicitly designed for CPG use cases - offering no-code, role-based dashboards with contextual intelligence like outlet-level trends and SKU targeting.