Retail Analytics in Southeast Asia: How FMCG Brands Can Identify Growth Opportunities
Explore how retail analytics helps FMCG brands in Southeast Asia identify whitespace outlets, improve shelf visibility, optimise distribution and drive growth.

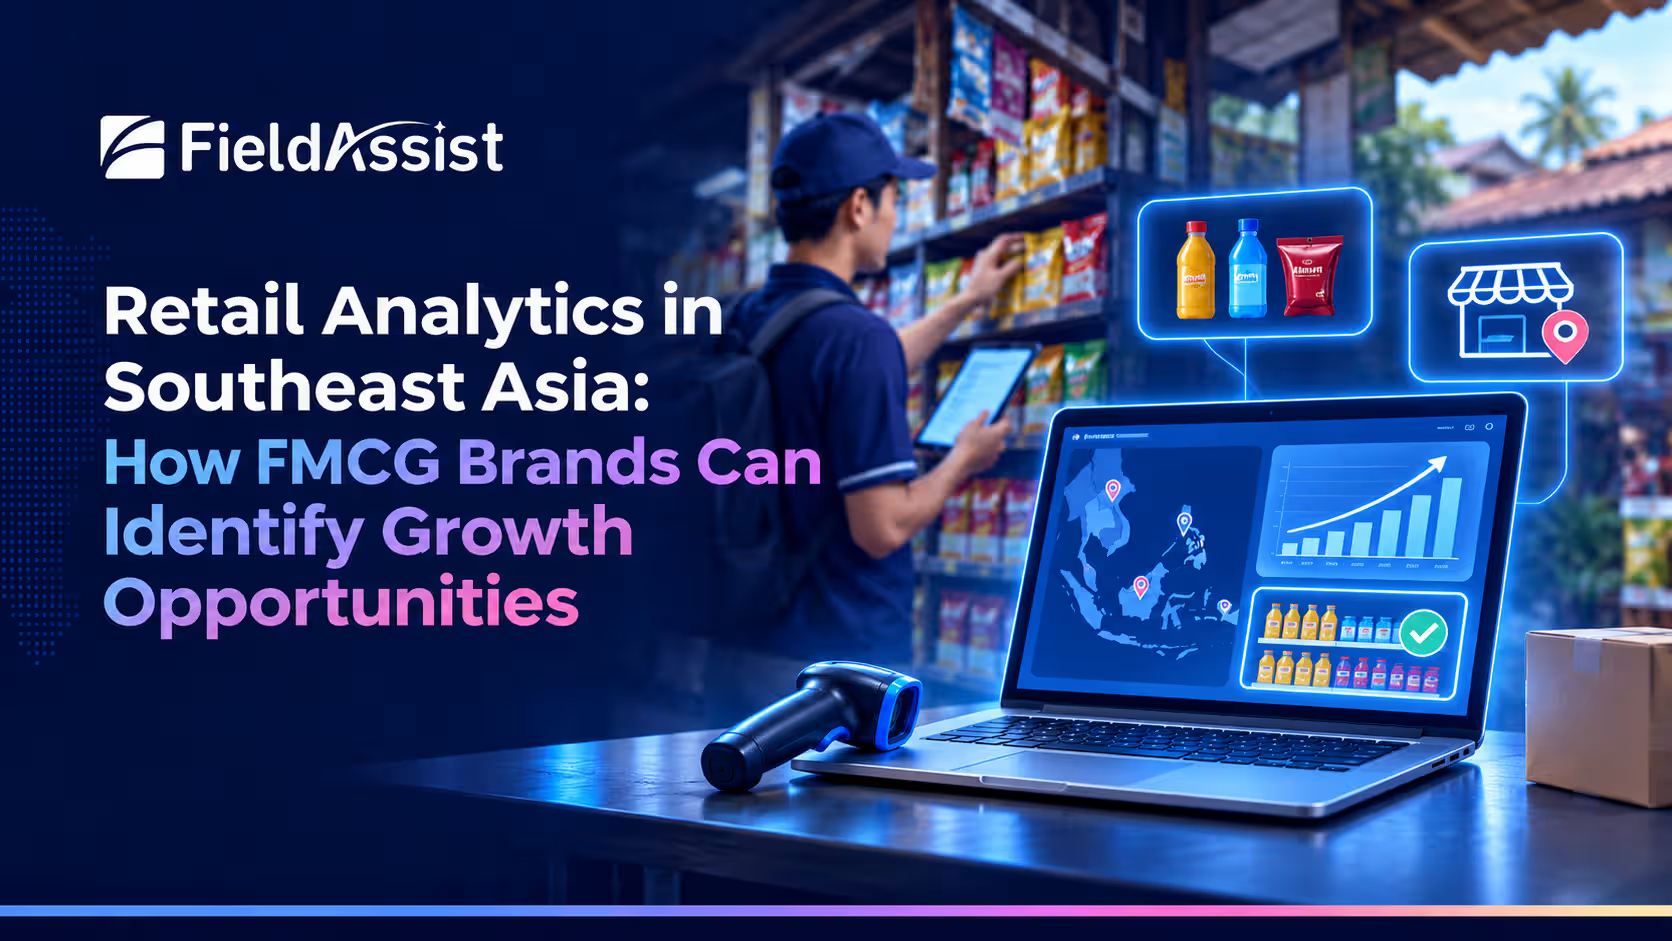
Walk a pasar in Jakarta, a row of sari-sari stores in Quezon City, or the kedai runcit lots on the edge of Kuala Lumpur, and the lesson lands quickly: the shelf is where strategy either becomes revenue or quietly dies. A brand plan can look airtight in a Singapore or Bangkok boardroom. If the warung two kilometres past the distributor never gets a visit, or a chohuay shop in Isan keeps pushing a rival’s pack, the plan goes nowhere.
That is the last-mile execution gap, and it is where retail analytics earns its keep in this region. Southeast Asia is ten markets, many languages, thousands of islands and millions of small outlets. The brands that grow here are not the ones with the most data. They are the ones that spot the right outlet, the right SKU and the right gap, then get a field rep to act before the week is out.
This guide covers what the numbers say, where analytics breaks down on the ground, and how FMCG teams can turn CPG market intelligence SEA into concrete growth moves.
Why the South East Asia Retail Analytics Market Is Heating Up for FMCG Brands
Start with where shoppers are. The e-Conomy SEA 2025 report from Google, Temasek and Bain & Company projects that the region’s digital economy will pass $300 billion in gross merchandise value in 2025, with e-commerce alone reaching about $185 billion. The same shopper now moves between Shopee carts, GrabMart orders, Alfamart aisles and the neighbourhood warung inside a single week. For a brand, that is one consumer leaving data trails across four channels, and none of them agree with each other.
Now the harder half of the story. A joint Bain & Company and NielsenIQ study found that Southeast Asia’s FMCG value growth eased to 1.8% in the first half of 2025, down from 3.5% in 2024. Growth has not vanished, but the rising tide has. It now has to be found outlet by outlet, category by category and province by province.
That squeeze is one reason the South East Asia Retail Analytics Market is moving from an IT line item to a commercial priority. When volume growth is thin, knowing which outlets underperform their potential is worth more than another round of blanket trade spend.
What the Global Retail Analytics Market Tells Us About Southeast Asia
Zoom out and the direction is clear. MarketsandMarkets values Asia Pacific retail analytics at roughly $1.38 billion in 2024 and projects about $4.54 billion by 2029, a 26.9% CAGR that it says outpaces a global average of 24%. Research houses size the global retail analytics market differently depending on what they count, so treat any single number as directional. What they share is the trend: money is moving into analytics faster in APAC than in mature markets.
Here is the catch for FMCG. Much of the tooling in the retail analytics market is built around large chains with clean point-of-sale data. A CPG brand in Indonesia or Vietnam sits on the other side of the counter, with volume flowing through distributors and thousands of small outlets that never produce a tidy data feed. Buying the same stack a European grocer uses does not close that gap.
The Last-Mile Data Gap in Southeast Asian Trade
Where the Retail Analytics Market Meets the Warung
Modern trade is easy to read. Indomaret, Alfamart, 7-Eleven and Big C scan everything at the till. General trade is the opposite: warung, sari-sari stores, kedai runcit, tạp hóa and chohuay shops, each with its own owner, its own credit terms and its own idea of what sells. A large share of FMCG volume still moves through these outlets in markets like Indonesia, Vietnam and the Philippines, and that is exactly where the least reliable data lives.
Distributor Data Arrives Late and Incomplete
Secondary sales usually reach the regional office as spreadsheets from distributor salesmen in Medan, Cebu or Can Tho, days or weeks after the fact. By the time a manager sees a SKU stalling, the promotion window has closed and the rep has moved on to the next beat. You are steering by the rear-view mirror, and the road keeps changing.
Reps Without a Reason to Walk Into the Outlet
A rep with 40 calls a day and a paper beat plan visits the outlets he already knows. Whitespace stays unvisited because nothing tells him it exists. A dashboard in head office does not fix that. Only a task landing in the rep’s app, with the outlet name, the gap and the pack to pitch, changes behaviour on the street.
What Retail Analytics Software in Southeast Asia Needs to Do
Not every platform that works in Chicago works in Cebu. Four capabilities separate useful tools from expensive reports.
1. Outlet-Level Visibility
Every outlet needs a unique ID, a GPS pin and a history: channel, size, visit frequency, what it stocks. Without that you are analysing averages, and averages hide the lane in Surabaya where your brand is simply absent.
2. Shelf Data From Image Recognition
A rep’s photo can become share of shelf, planogram compliance and competitor facings in seconds. Clipboard audits cannot cover thousands of outlets per territory with any consistency, and they cannot be verified after the fact.
3. Offline-First Mobile
Connectivity drops on outer islands, in Mindanao’s interior and in the basement of a wet market. If the app needs a signal to log a visit, reps will stop logging visits. It has to work offline and sync when the signal returns.
4. Local Language and Local Structure
Reps work in Bahasa Indonesia, Bahasa Melayu, Filipino, Vietnamese and Thai, not English. The system also has to understand local distributor structures, multi-currency reporting and sachet-heavy price packs. If your field team needs a training deck to read the screen, adoption will stall.
CPG Market Intelligence SEA: Five Ways to Find Your Next Growth Opportunity
Good CPG market intelligence SEA is not a report. It is a short list of outlets, packs and visits that a field team can act on this week. Five places to look first:
- Whitespace Outlets
Map outlets that sell your category but do not stock your brand. A territory can show healthy numeric distribution and still miss the high-footfall corner stalls that drive the category. Mapping at micromarket level, by postcode or kelurahan, shows where to send the next beat and which distributor should cover it.
- Pack-Price Architecture
The sachet economy, or tingi in Filipino retail, means the same brand can win or lose on pack size alone. Outlet data shows which formats move in the pasar and which belong on a 7-Eleven shelf. A pack that sells well in Jakarta may sit untouched in rural Mindanao.
- Channel Migration
Quick commerce, GrabMart, Shopee Mall and TikTok Shop are changing where baskets get bought in the big cities. Compare outlet-level sell-out with online share by city so you can see where the channel is shifting, instead of guessing.
- Promotion and Trade Spend Returns
A Hari Raya or Tet promotion that lifts volume in modern trade may do nothing in a kedai runcit. Outlet-tagged sell-out lets you compare spend and uplift by channel, and cut what does not pay back.
- Out-of-Stocks and Smarter Forecasts
Empty shelves in outlets you already serve are the cheapest growth to recover. Predictive models can flag likely stock-outs before the rep walks in. Gartner expects 70% of large organisations to adopt AI-based demand forecasting by 2030, which tells you where planning is heading.
How to Evaluate Retail Analytics Software in Southeast Asia?
Ask every vendor five blunt questions:
- Does it start from the outlet, or from head-office reports?
- Does it work offline in the field?
- Does insight become a task in the rep’s beat plan, or stay on a dashboard?
- Does it connect to your DMS and ERP so primary, secondary and sell-out numbers agree?
- Does it support Bahasa, Filipino, Vietnamese and Thai for reps and managers?
AI is the other filter. McKinsey estimates generative AI could add $400 billion to $660 billion a year in value for retail and CPG, but that value rests on clean outlet-level data underneath. A model sitting on messy outlet master data is still messy.
How FieldAssist Closes the Last-Mile Execution Gap?
FieldAssist is built for exactly this gap. Micromarket maps outlets and whitespace down to the micromarket level, so brands can see where distribution is thin. IRIS turns shelf photos into image-recognition data on availability and share of shelf. SFA and DMS carry the insight into the rep’s beat plan and the distributor’s stock position, and Perfect Store scores execution against your standards.
The point is not another dashboard. It is a closed loop: find the gap, assign the visit, verify the shelf. Explore more at fieldassist.com.
Turning Insight Into Shelf Reality
The South East Asia Retail Analytics Market will keep growing, and the global retail analytics market will keep drawing investment, but neither pays off until data reaches the shelf of a warung owner in Bekasi or a sari-sari store in Cebu.
Retail analytics software in Southeast Asia deserves one test: did a rep do something different on Tuesday because of it? Start with clean outlet IDs, build a whitespace list, and pilot image-recognition audits in one territory. As the retail analytics market matures, brands that treat CPG market intelligence SEA as an execution discipline, not a reporting exercise, will find growth that blanket spend misses.