What is a Route-to-Market (RTM) Strategy? (And How to Build One)
A C-suite guide to Route-to-Market strategy for CPG & FMCG brands. Cut cost-to-serve, fix channel conflict, and build an RTM that scales. With KPIs & framework.

%20Strategy_11zon.avif)
A Route-to-Market (RTM) strategy is the operational blueprint a manufacturer uses to move a physical product from the factory floor to the end consumer's hands through distributors, wholesalers, retailers, or direct channels at the lowest possible cost-to-serve. It is the execution layer that determines whether a Go-to-Market strategy actually delivers volume, margin, and shelf presence. For CPG and FMCG enterprises, RTM is the single largest determinant of P&L performance after product cost itself, because trade spend alone consumes 20–30% of revenue.
If your brand is sold in 50,000 stores but available on the shelf in only 32,000 of them on any given Tuesday, you do not have a marketing problem. You have an RTM problem. This guide is written for CEOs, CROs, COOs, and CFOs who need to fix that gap — not theorize about it.
Route-to-Market (RTM) vs. Go-to-Market (GTM): What is the Difference?
The two terms, GTM and RTM are used interchangeably in boardrooms and they should not be. GTM answers the question "Why should anyone buy this?" RTM answers the question "How does this actually reach the buyer at a profitable cost?" A failed GTM strategy means weak demand. A failed RTM strategy means strong demand that cannot be fulfilled — which is more expensive.
The practical takeaway: GTM gets the buyer to want the product. RTM gets the product in front of the buyer at the moment of purchase intent. Brands that win execute both — but the ones that scale profitably are obsessive about RTM.
Understanding FMCG and Retail Route-to-Market Dynamics
The economics of FMCG distribution are unforgiving. Trade spend consumes 20–30% of FMCG revenue before a single marketing dollar is spent. Slotting fees alone run $5,000–$50,000+ per SKU per chain at major US retailers, and when a distributor handles slotting on the brand's behalf, that cost typically inflates by 50% or more.
Three structural realities define FMCG/CPG RTM:
1. The network is fragmented, multi-tiered, and partially blind
A typical CPG brand routes through a hierarchy that includes super stockists (regional aggregators holding bulk inventory), stockists/distributors (sub-territory operators), wholesalers, and retailers. Once product leaves the distributor's warehouse, most brands lose direct sight of secondary and tertiary movement. They are flying blind from the second invoice onward.
2. Shelf space is a zero-sum war
In a US grocery store carrying ~30,000 SKUs, every facing your brand wins comes at a competitor's expense. Slotting fees do not guarantee eye-level placement, a specific number of facings, or even guaranteed duration on shelf — they only buy the right to compete for it.
3. Hyper-local distribution defeats national playbooks.
General trade (independent mom-and-pop stores) accounts for roughly 70% of FMCG sales across emerging markets and remains a critical layer in US neighborhood and ethnic retail. The average small retailer turns $3,000–$4,000 per month in sales, which means credit terms, minimum order quantities, and visit frequency must be designed for that economic reality, not a Walmart account's.
The "last mile" - the final stretch from distributor warehouse to retail shelf - is where RTM strategies live or die. This is the gap FieldAssist was built to close: giving brands real-time visibility and AI-driven control over what happens between the distributor's invoice and the retailer's shelf.
Why Your Business Needs a Dedicated RTM Strategy?
A dedicated RTM strategy is not an operational nicety. It directly moves four numbers that show up in your board deck:
- Lowering Customer Acquisition Cost (CAC). When your product is on shelf at the moment of consumer intent, you do not need to pay a digital ad to re-acquire that buyer. On-shelf availability is the cheapest CAC channel a CPG brand has — and the one most chronically underfunded.
- Eliminating channel conflict. When direct e-commerce undercuts a distributor's pricing, or when two distributors poach each other's retailers, the cost is silent margin erosion. Industry benchmarks treat a Channel Conflict Rate above 10% as a code-red signal requiring immediate realignment. Most brands do not measure it at all.
- Optimizing cost-to-serve by SKU and outlet. A national distribution model treats every retailer the same. A real RTM strategy segments outlets by sales velocity, basket size, and credit risk, then assigns the appropriate distribution model — direct sales, van sales, super stockist, or e-B2B — to each tier. The savings typically run 8–15% of total trade spend.
- Scaling into new territories without doubling overhead. A documented, technology-enabled RTM is a replicable playbook. Brands without one rebuild distribution from scratch every time they enter a new region — and pay the learning curve twice.
If your sales team is hitting volume targets but margin is compressing quarter over quarter, the diagnosis is almost always RTM, not pricing.
Who Owns RTM? Aligning the CRO, COO, and CFO
RTM fails most often inside the company, not in the field. The reason is structural: three different C-suite owners measure success on three different scorecards.
- The CRO wants volume. Top-line growth, distribution width, new outlet acquisition. Their instinct is to add more distributors and more SKUs.
- The COO wants efficiency. Order fulfillment cycle time, fill rate, inventory turns. Their instinct is to consolidate distributors and rationalize SKUs.
- The CFO wants margin. Cost-to-serve, trade spend ROI, working capital. Their instinct is to cut both — and is usually overruled by the other two.
Without a single owner, RTM decisions get made by whoever shouts loudest in the QBR. The fix is not to pick one of the three — it is to make RTM a shared P&L owned at the COO or Chief Commercial Officer level, with weekly visibility for all three on a common data layer. The KPIs cannot live in three different systems. When the CRO's CRM, the COO's ERP, and the CFO's BI tool all pull from different sources, alignment is theatrical, not operational.
This is why modern RTM transformations begin with a unified data spine, typically an integrated SFA + DMS + analytics layer, before any process change is rolled out.
The Financial Impact: Margins, Cost-to-Serve, and CAC
RTM economics show up in three places on the P&L, and each one is large enough to move the stock price for a public CPG company:
- Trade Spend (15–30% of gross sales). This is the single largest discretionary line on a CPG income statement. Slotting, listing fees, promotional discounts, distributor margins, and rebates. A 200-basis-point improvement in trade spend ROI on a $500M brand is $10M of EBITDA — which is typically more than the entire annual marketing budget.
- Cost-to-Serve. The fully loaded cost of fulfilling an order through a given channel. A modern trade order to a Kroger DC has a different cost-to-serve than a 12-unit case dropped at a bodega. Most brands have never calculated this at the outlet level. When they do, they typically discover that the bottom 30% of outlets are loss-making on a fully loaded basis.
- Working Capital and DSO. CPG brands operate on payment terms of 60–120 days with major retailers. A 5-day reduction in Days Sales Outstanding on a $1B revenue base frees up roughly $14M in working capital — cash that was previously locked in transit between distributor and retailer.
- CAC for FMCG is largely the cost of presence, not the cost of advertising. A brand whose on-shelf availability moves from 78% to 92% effectively reduces its CAC by the cost of every digital impression that previously had to compensate for an empty shelf. This is the math most marketing-led organizations miss.
Mitigating Supply Chain Risk Through RTM Diversification
Global FMCG players faced a Y-O-Y rise in logistics and input costs. The brands that absorbed it best were the ones with the most diversified RTM.
A resilient RTM portfolio includes:
- Channel diversification. Modern trade, general trade, e-B2B, quick commerce, foodservice, and DTC each respond differently to disruption. A brand that is 80% reliant on modern trade is one retailer trade dispute away from a bad quarter.
- Distributor concentration risk. If your top three distributors account for more than 50% of secondary sales in any region, you have a single-point-of-failure. Industry best practice is no single distributor exceeding 20% of regional volume.
- Geographic redundancy. Entering rural and tier-3/4 markets is not just a growth play — it is a hedge. When urban demand softens, rural and semi-urban networks tend to remain stable, and the inverse holds true.
- Inventory positioning. Centralized warehousing optimizes for cost; distributed warehousing optimizes for resilience. Most brands over-rotate to cost. The 2020–2024 supply shocks proved why that is a mistake.
RTM diversification is the supply-chain version of a hedged equity portfolio. It costs slightly more in good years and is the only thing that keeps you solvent in bad ones.
How to Build a Winning Route-to-Market Strategy in 4 Phases
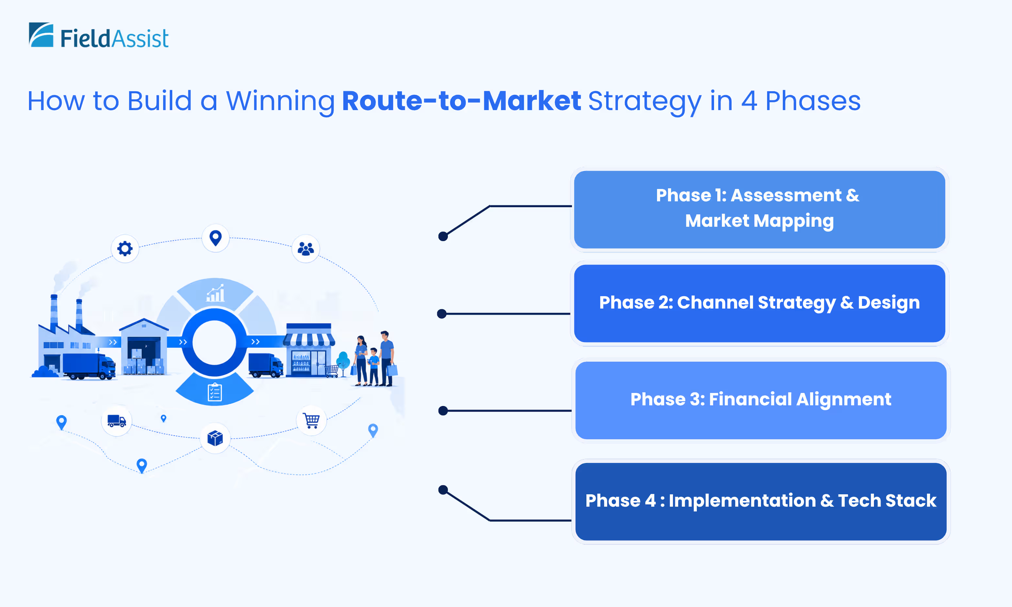
Phase 1: Assessment & Market Mapping
Before you redesign anything, document what you already have. Map every distributor, every outlet covered (and not covered), and every dollar of trade spend by channel. Overlay competitor RTM — where they are present that you are not is your white space; where you both compete is your share-of-shelf battle. Geo-map demand against current coverage and you will typically find that 20–30% of your trade spend is reaching outlets that produce less than 5% of your volume.
Deliverable: A territory-level heat map of coverage, gaps, competitive presence, and cost-to-serve.
Phase 2: Channel Strategy & Design
Match the right ideal customer profile to the right channel. A premium SKU does not belong in the same van-sales beat as a value pack. Define which outlet tiers get direct sales, which get distributor coverage, which get van sales, and which get e-B2B self-service. Define the rules of engagement between channels — who owns which outlet, who sets which price, who books which promotion.
Deliverable: A channel architecture document with explicit boundaries, pricing rules, and outlet segmentation.
Phase 3: Financial Alignment
Calculate the full margin stack at every layer: manufacturer, distributor, retailer, plus all incentives, rebates, and trade promotions. Stress-test the model — what happens to distributor profitability if volume drops 15%? If freight rises 10%? Most distributor failures are not loyalty issues; they are math issues that nobody on the manufacturer side modeled.
Deliverable: A channel P&L by tier, including breakeven volume per distributor and trade spend ROI by SKU.
Phase 4: Implementation & Tech Stack
Strategy without instrumentation is theater. The minimum viable RTM tech stack includes:
- Sales Force Automation (SFA) to direct rep activity, capture orders, and enforce beat plans.
- Distributor Management System (DMS) to digitize primary and secondary sales, inventory, and claims.
- Van Sales Automation for cash-and-carry and direct delivery routes.
- Retailer App / e-B2B to give retailers a self-service ordering channel and reduce cost-to-serve on tail-end outlets.
- Image Recognition / Perfect Store to verify shelf execution objectively, not through rep self-reporting.
- Auto-Replenishment / Predictive Inventory AI to remove guesswork from stock decisions.
- Analytics / Co-Pilot Layer to compress the time between data and decision.
This is the layer FieldAssist powers for over 700 CPG and FMCG brands across 32 countries, including Coca-Cola, Unilever, Mars, Haldiram's, Bisleri, Parle, and Beiersdorf, tracking $23.6 billion in GMV across 8.9 million outlets.
Common RTM Mistakes to Avoid
Most RTM failures are not strategic — they are operational, repeated quarter after quarter because no one is held accountable for them.
- Choosing distributors on relationship, not data. Legacy distributors get renewed because "we've worked with them for 15 years," even when their secondary sales velocity is half the regional average.
- Failing to train indirect sales teams. A distributor's reps are not your reps. They sell whatever pays them best that month — usually a competitor — unless you give them tools, incentives, and visibility that change the math.
- Treating cost-to-serve as a logistics problem. It is a portfolio problem. The fix is rarely cheaper trucking; it is the right outlet on the right channel.
- Overlapping channels causing cannibalization. When DTC pricing undercuts retail, when Amazon undercuts both, when modern trade promotions leak into general trade — this is governance failure, not channel failure.
- Confusing primary sales for demand. A truck leaving your factory is not a sale — it is a transfer. Real demand is sell-through at the retail shelf. Brands that report on primary sales alone are running on a 60–90 day delay.
- Skipping the audit cadence. RTM is dynamic. Markets shift, retailers consolidate, distributors fail. A quarterly RTM audit is the minimum hygiene; many brands do it every two or three years and wonder why they get blindsided.
A 5-Step Framework to Audit Your Current RTM Strategy
Take this to your next leadership meeting. If you cannot answer all five questions with numbers — not narratives — your RTM is at risk.
- What is our on-shelf availability, by SKU, by retail tier, this week? If the answer is "we get it monthly from the distributor," you are running blind.
- What is our cost-to-serve, fully loaded, for our top 100 outlets versus our bottom 30%? If the bottom tier is loss-making, why is it still being served on the same model?
- What is our distributor turnover rate, and what was the cost of replacement last year? Distributor churn is the FMCG equivalent of customer churn — and just as expensive.
- What is our Channel Conflict Rate? Track the percentage of revenue affected by pricing or territory disputes between channels. Above 10% is a board-level issue.
- If our top three distributors disappeared tomorrow, what percentage of national volume would we lose, and how long would replacement take? If the answer is more than 90 days for any region, you have unhedged operational risk.
Aligning Sales Operations with Supply Chain Logistics
The single most expensive friction in any CPG enterprise is the gap between what the sales team promises and what the supply chain can deliver. Sales books an order; supply chain ships short; retailer levies a deduction; finance writes off the deduction; nobody reconciles the loss. This silent leakage typically costs 1–3% of net revenue.
Aligning the two functions requires three things:
- A single source of truth for inventory. Real-time visibility into distributor stock positions, in-transit inventory, and DC availability — not yesterday's spreadsheet.
- Demand signals that flow upstream. Secondary sales data from retail outlets must reach the supply chain planning team within hours, not weeks. This is what Auto-Replenishment Systems (ARS) automate.
- A common operating cadence. Sales operations and supply chain reviewing the same dashboard, in the same meeting, weekly. Not in separate functional silos with reconciliation delays.
When this alignment exists, fill rates rise, deductions fall, and working capital is freed without any change in strategy — purely from removing friction.
The 5 KPIs Every Board Wants to See for RTM Success
The metrics that matter at the board level are the ones that tie execution to enterprise value. These five are non-negotiable:
- Channel Contribution Margin. Net revenue minus all variable channel costs (distributor margin, trade spend, logistics, returns) by channel. The number that tells you which channels actually make money.
- Cost-to-Serve per Outlet (or per $100 of revenue). The fully loaded cost of getting one dollar of product into one retailer. The metric that exposes which 30% of your distribution is destroying value.
- Perfect Order Fulfillment Rate. Orders delivered on time, in full, without damage, and with accurate documentation. The composite metric of operational excellence. Best-in-class CPG runs 95%+; most brands sit at 78–85% and do not realize it.
- On-Shelf Availability (OSA). The percentage of outlets where your SKUs are physically present and visible at the moment of consumer intent. The single most predictive metric of organic share growth.
- Distributor Turnover Rate (and Average Distributor Tenure). High turnover signals broken economics for partners. Healthy CPG networks see <8% annual distributor turnover.
Two additional metrics earn an honorable mention because they are increasingly tracked by sophisticated boards: Order Fulfillment Cycle Time (days from order capture to retailer receipt) and Trade Spend ROI (incremental gross profit per dollar of trade spend). Both are leading indicators of whether the RTM is improving or quietly degrading.
Digital Transformation in RTM: Data, Platforms, and PRM
The era of running RTM on Excel, WhatsApp, and end-of-month distributor declarations is ending - fast. McKinsey reports that sales force automation alone drives 20–25% efficiency gains and 10–30% sales uplift, automating roughly one-third of sales tasks. The brands that have already digitized their RTM are compounding ahead of the ones that have not.
The modern RTM tech stack is modular but interconnected. FieldAssist's RTM platform — used by Coca-Cola, Unilever, Mars, Bisleri, Parle, Haldiram's, Nivea, Mrs. Bectors, and 700+ other CPG brands — is structured across three tiers:
Tier 1: Information (the system of record)
- Sales Force Automation (SFA): AI-driven beat plans, geo-tagged check-ins, instant order booking. FieldAssist client data shows unique outlets per SKU rising 31% and productive calls improving 10% post-deployment.
- Distributor Management System (DMS): Digitizes the primary–secondary sales chain, automates invoicing, claims, and inventory tracking across the distributor network.
- Van Sales Automation: On-route billing, inventory sync, and direct fulfillment for cash-and-carry models — critical for tier-3/4 markets and underserved geographies.
- Retailer App / e-B2B: Self-service ordering for retailers; reduces cost-to-serve on tail-end outlets and removes manual order-taking friction.
- Rural Distribution Management: Purpose-built for the operational realities of low-connectivity, low-density geographies where standard urban RTM models break.
Tier 2: Insight (the analytics layer)
- Analytics Studio / Sales Reporting Software: Self-serve dashboards across SKU, outlet, and call-level performance — no analyst dependency.
- Pulse AI / FAi Sales Co-Pilot: Conversational AI that surfaces churn risk, lost-sale predictions, and revival actions before gaps widen.
Tier 3: Impact (the AI execution layer)
- Auto-Replenishment System (ARS): Predictive inventory AI that triggers reorders based on actual sell-through patterns, removing human guesswork.
- Market Intelligence / Micromarket: Hyper-local demand intelligence that informs which SKU mix wins in which postcode.
This is what Partner Relationship Management (PRM) looks like in CPG: not a generic SaaS overlay, but a purpose-built distribution operating system that gives the manufacturer real-time line of sight from factory to shelf.
Designing RTM for Global Market Expansion
A US-designed RTM does not survive contact with Southeast Asia, EMEA, the Middle East, APAC, or LATAM. The core principles transfer; the execution does not. The executive playbook for adapting:
- For Southeast Asia and South Asia: General trade dominates. Indonesia, the Philippines, India, and Vietnam are powered by millions of small mom-and-pop outlets that demand high-frequency, low-AOV servicing. Van sales and super-stockist models outperform direct distribution. Credit terms must be designed for retailers doing $3,000–$4,000/month, not $30,000.
- For EMEA: Modern trade share is high in Western Europe, but trade promotion regulations vary by country. Pan-European RTM plans rarely work; country-by-country governance is the only sustainable design.
- For the Middle East: Heavy reliance on national distributors who hold exclusive import rights. The leverage sits with the distributor, not the brand. RTM design must include explicit performance triggers and exit clauses, or the manufacturer becomes a passenger in their own growth story.
- For APAC (developed markets — Japan, Korea, Australia): High modern trade penetration, sophisticated retailer demands, and slotting economics that resemble the US. Tech stack must integrate with retailer EDI standards from day one.
- For LATAM: Heterogeneous in the extreme. Brazil and Mexico have urban modern trade plus massive rural general trade. Argentina and Colombia have currency volatility that breaks margin models built on US-dollar assumptions. Currency hedging must be baked into the trade spend architecture.
The universal rule: do not export your domestic RTM. Hire local commercial leadership, instrument the network from day one, and build channel partnerships before you build SKU breadth. FieldAssist supports brands across 32 countries with this exact transformation, and the most consistent failure pattern we see is the assumption that "what worked in our home market will scale."
Frequently Asked Questions
1. What is the difference between RTM and distribution strategy?
Distribution strategy is a subset of RTM. Distribution focuses narrowly on the physical movement of goods — warehousing, transportation, channel partner selection. RTM includes distribution but extends to the full commercial architecture: channel design, pricing rules, trade spend allocation, sales force model, technology stack, and KPI governance. RTM is the boardroom conversation; distribution is the operational execution within it.
2. How long does it take to implement a new RTM strategy at an enterprise CPG company?
A full RTM transformation at a national CPG brand typically runs 9–18 months end-to-end, broken into the four phases above. The assessment and design phases take 2–4 months. Tech deployment (SFA, DMS, retailer apps) takes 3–6 months depending on distributor onboarding complexity. Behavior change and KPI adoption — the hardest part — takes 6–12 months. Brands that try to compress this into 90 days almost always rebuild within two years.
3. How do retail tech solutions enhance route-to-market efficiency?
Retail tech solutions remove the three structural inefficiencies in legacy RTM: latency, opacity, and inconsistency. Latency disappears when secondary sales flow in real time instead of monthly distributor declarations. Opacity disappears when image recognition and geo-tagged check-ins verify shelf execution objectively. Inconsistency disappears when AI-driven beat plans and dynamic incentives ensure every rep, in every territory, executes against the same standard. The compound impact is typically 10–25% sales uplift and 15–30% reduction in cost-to-serve.
4. Should we go direct-to-consumer (DTC) or stick with traditional RTM?
The honest answer for most enterprise CPG brands is "both, but governed." DTC captures zero- and first-party data and protects against retailer concentration risk. Traditional RTM delivers volume at scale that DTC cannot match — Amazon and a brand's own website combined rarely exceed 10–15% of revenue for an established CPG. The trap is treating them as separate strategies. They must operate inside one channel architecture with explicit pricing rules (typically MAP enforcement), promotional alignment, and inventory governance. Channel conflict above 10% destroys more value than DTC creates.
5. What is the single highest-ROI investment in RTM transformation?
For most CPG enterprises, it is closing the secondary sales visibility gap. The moment you can see, daily, what is selling through to retail (versus what is sitting in distributor warehouses), every other decision becomes sharper: trade spend allocation, inventory positioning, distributor performance management, SKU rationalization. This is what an integrated SFA + DMS deployment delivers, and the payback period is typically under 12 months on a national brand.


.avif)
%205%20(1).avif)