The CPG Masterclass on Shelf Space Optimization: Dominating Share of Shelf (SoS) with AI
Master CPG Share of Shelf (SoS) optimization. Learn how to leverage computer vision, win JBP negotiations, and eliminate phantom inventory with FieldAssist.

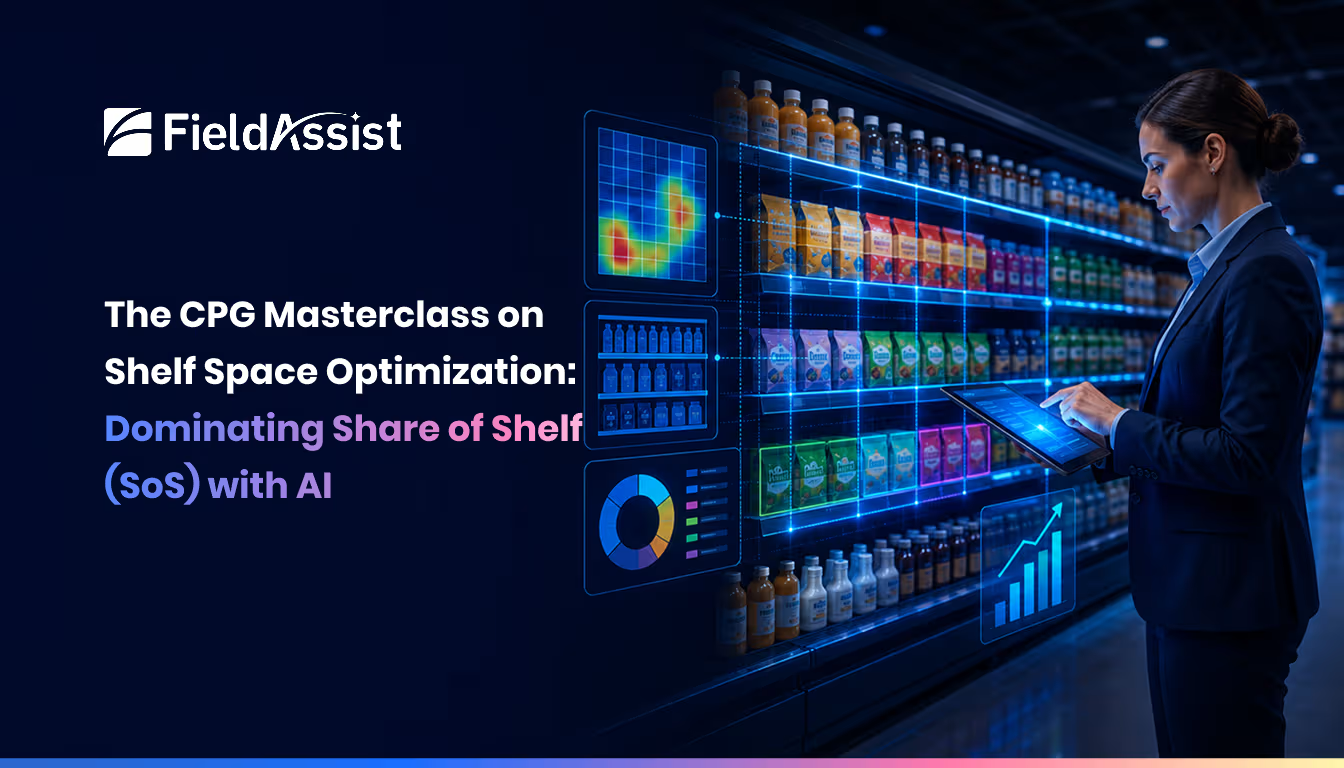
Physical retail shelf space is the most valuable real estate on earth. For our executive leadership team, the link between physical shelf positioning and revenue market share is absolute. Commercial benchmark research from Gartner Research proves a decisive point: consumer brands that maintain an eye-level Share of Shelf (SoS) exceeding their Share of Market (SoM) by a factor of 1.2x achieve a 4.8% higher annual revenue growth rate compared to competitors with under-allocated facings.
Yet, we often negotiate annual retail space allocations using historical guesswork, subjective relationships, and incomplete sample audits. When we lose eye-level facing real estate to a competitor, our marketing spend efficacy drops immediately. To dominate physical retail and win Joint Business Planning (JBP) negotiations, we must weaponize empirical visual intelligence to audit, defend, and optimize every inch of shelf space.
The Ergonomics of Retail Revenue: Why Placement Dictates Sales?
In physical retail, consumer purchasing behavior is driven by strict visual ergonomics.
Studies prove that products placed in the 'Golden Zone' (eye level to waist level) capture over 70% of total visual attention and generate up to 35% higher sales velocity than bottom-shelf placements.
Losing eye-level facing space to a competitor triggers a dangerous downward spiral. Products pushed to bottom shelves lose 35% of customer visual attention, causing a drop in sales velocity that retail buyers then use to justify further space reductions. We must actively defend our shelf real estate.
Our commercial growth depends on managing two key metrics:
- Share of Shelf (SoS): The percentage of physical shelf facing space occupied by our brand within a category.
- Share of Market (SoM): The percentage of total category revenue captured by our brand in a given market.
When our Share of Shelf drops below our Share of Market, we are effectively subsidizing competitor growth. Defending our fair share of shelf space requires continuous visual tracking via shelf tracking tools.
Winning Joint Business Planning (JBP) with Empirical AI Data
Annual Joint Business Planning (JBP) negotiations with retail buyers are traditionally contentious.
Retail buyers routinely demand higher promotional allowances or slotting fees in exchange for prime placement. Armed with real-time computer vision data, we transform JBP negotiations from subjective bargaining into data-driven commercial partnerships.
When our key account managers enter annual Joint Business Planning (JBP) negotiations armed with objective store-level computer vision data, we change the conversation entirely. We prove exactly how our eye-level facings maximize total category profit for the retailer, securing prime placement while resisting unearned margin concessions using FieldAssist Market Intelligence Software.
By presenting objective store-level compliance data collected via FieldAssist, we prove exactly how our eye-level SKU facings maximize total category profit margins for the retailer, securing premium shelf real estate while resisting unearned margin concessions.
Space-to-Sales Elasticity & Eliminating Phantom Inventory
Optimizing shelf space requires calculating space-to-sales elasticity—measuring the exact incremental sales volume generated by adding one extra facing to a specific SKU.
Reallocating facings from slow-moving long-tail SKUs to high-velocity hero products maximizes sales per linear foot.
Calculating space-to-sales elasticity allows us to optimize shelf space down to the inch. Reallocating facings from slow-moving secondary SKUs to high-velocity hero products maximizes sales per linear foot while eliminating phantom inventory stockouts.
Computer vision shelf audits also eliminate 'phantom inventory'—conditions where POS systems show product available, but physical shelves are empty due to backroom stock misplacement. Instant mobile alerts on FieldAssist Sales Force Automation direct reps to restock empty facings immediately, while central dashboards in FieldAssist AI Sales Intelligence ensure executive alignment.
Evaluating Space Optimization Models: The CXO Decision Matrix
As we evaluate shelf space optimization strategies, we must compare analytical precision, negotiation leverage, and execution costs. The decision matrix below outlines our options.
As outlined in the decision table, intuition-led negotiations leave us vulnerable to retailer pressure. Weaponizing empirical AI visual census data grants us decisive leverage during category reviews, driving a predictable 4.8% to 8% annual revenue lift.
Our Commercial Blueprint for Market Dominance
To dominate Share of Shelf and outperform competitors across retail channels, we will execute a four-phase commercial framework:
1. Conduct a Nationwide SoS Benchmark Audit
We deploy automated image recognition via FieldAssist Retail Image Recognition Software to establish a definitive census of our facing ratios versus competitors across all retail tiers.
2. Rationalize Low-Velocity SKUs
We reallocate shelf space from slow-moving secondary SKUs to top-performing hero products to optimize space-to-sales elasticity.
3. Arm Sales Reps with Live IR Mobile Tools
We equip field reps with SFA app for instant visual auditing and displacement detection during daily visits.
4. Institutionalize Empirical Category Reviews
We embed live shelf intelligence into quarterly retailer account reviews to protect contracted eye-level facings, ensuring physical shelf space remains our strongest moat against market share erosion.
FAQ:
Q: What is Share of Shelf (SoS) and why is it critical for CPG revenue growth?
A: Share of Shelf measures the percentage of physical shelf space a brand occupies vs. competitors; higher SoS directly correlates to higher market share.
Q: How does AI detect unauthorized competitor shelf expansion?
A: Computer vision algorithms analyze shelf images to alert reps whenever competitors displace your contracted facings.
Q: What is space-to-sales elasticity in retail execution?
A: The metric measuring how incremental shelf facings impact unit sales velocity, allowing optimal space allocation per SKU.
Q: How do CPG leaders use AI shelf data during Joint Business Planning (JBP) with retailers?
A: Brands present objective, store-level compliance data proving how their product facings drive category margin for the retailer.
Q: What is 'phantom inventory' and how does shelf-space AI eliminate it?
A: Phantom inventory occurs when POS shows stock but shelves are empty; AI vision identifies empty facings despite system stock counts.
Q: How often should CPG brands audit store shelf space?
A: With AI Image Recognition, shelf audits shift from quarterly spot-checks to daily or weekly automated intelligence.
Q: What top-line growth can an enterprise CPG expect from optimizing Share of Shelf?
A: Enterprise CPGs achieving optimal Share of Shelf alignment systematically see a 4% to 8% increase in category sales volume.





.avif)