Computer Vision in Retail: And How it Reshapes Sales and Execution
Discover how computer vision in retail improves shelf visibility, OSA, and compliance. Learn how AI-powered image recognition drives FMCG sales growth.


Computer vision in retail is the application of AI-trained image recognition models to convert in-store photographs into structured, quantifiable data on planogram compliance, on-shelf availability, share of shelf, and promotional execution. For CPG and FMCG manufacturers, it replaces subjective field reporting with objective, audit-grade visual evidence at scale.
The retail execution problem is no longer about insufficient data. It is about the wrong kind of data. Sales teams generate millions of store visits per year, yet NielsenIQ documented $82 billion in lost U.S. CPG sales in 2021 alone due to on-shelf availability failures, equivalent to 7.4% of total category sales. The execution gap between what brands negotiate at headquarters and what shoppers see at the shelf is the largest unaddressed revenue leak in modern consumer goods.
This article gives retail execution leaders a structured framework for deploying computer vision retail automation across compliance, availability, competitive intelligence, and shopper journey workflows — ending with a direct path to implementation through FieldAssist IRIS.
The Strategic Role of Computer Vision in Retail Operations
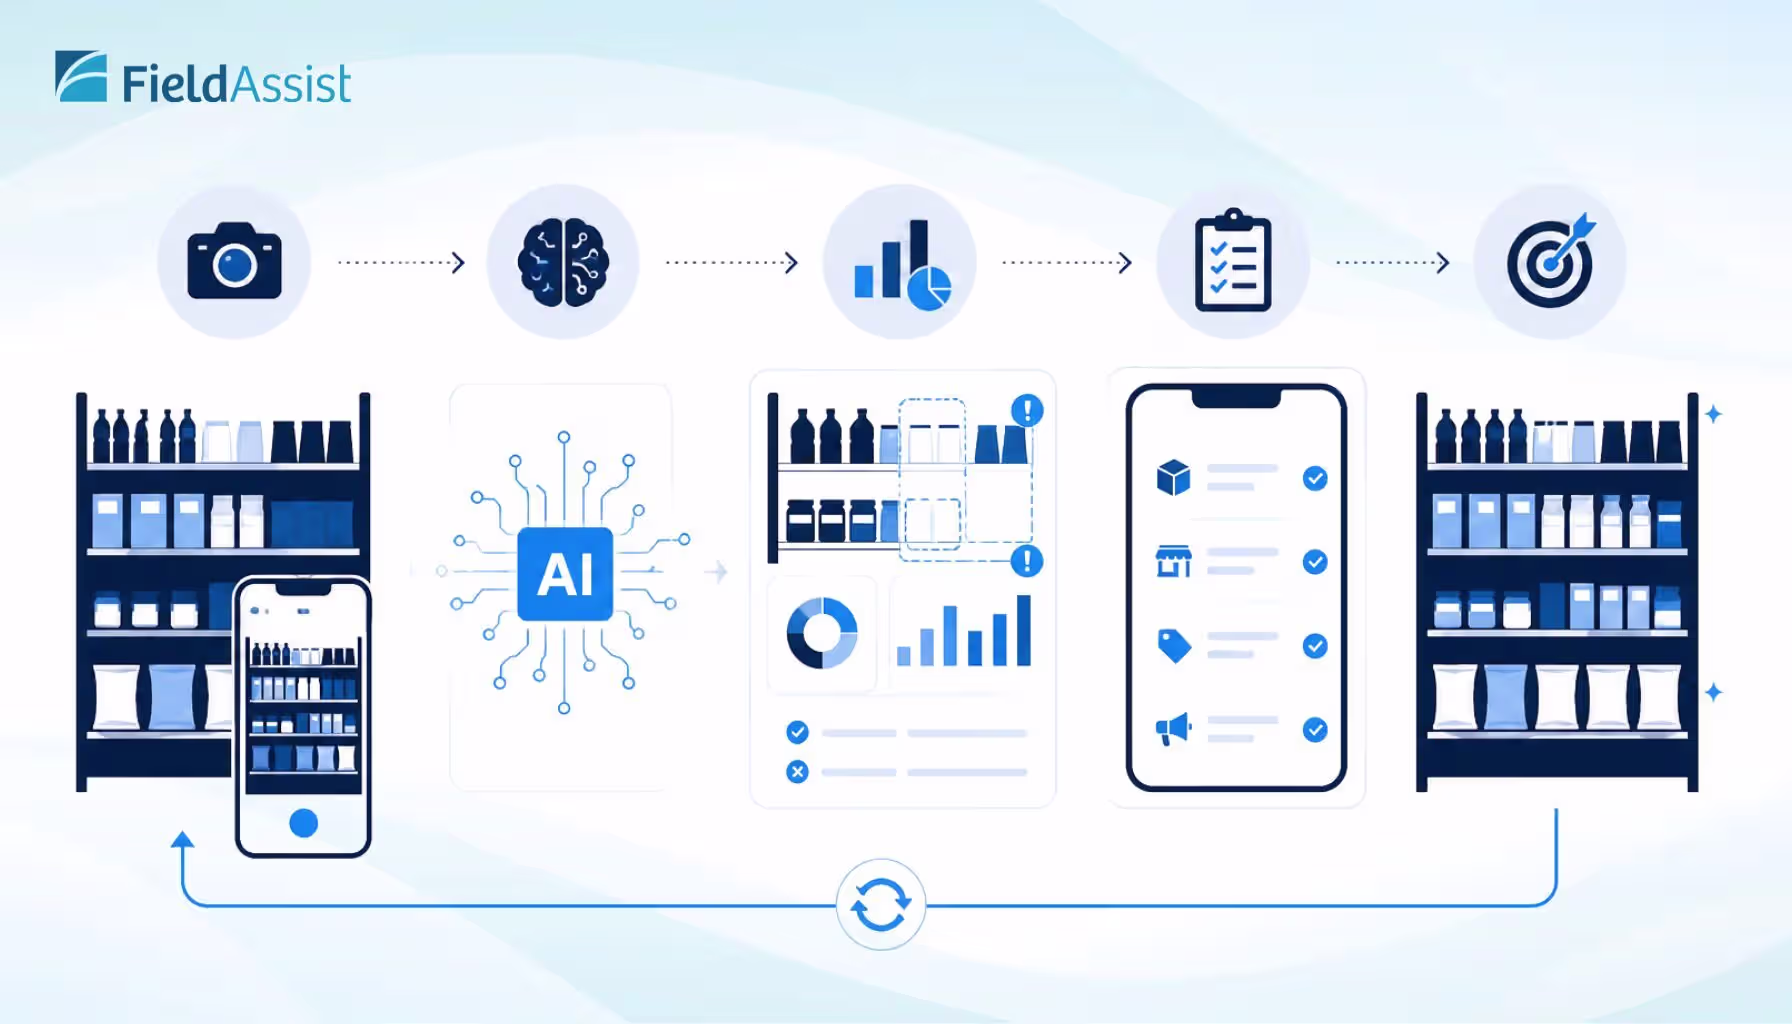
Computer vision in retail operations is the use of convolutional neural networks and deep learning classifiers to process shelf, display, and store images into measurable KPIs that feed directly into sales, supply chain, and trade marketing decisions.
For the C-suite, the strategic value sits in three quantifiable shifts:
- Audit volume increases by 5x to 10x, because a field rep capturing a shelf photo replaces a 20-minute manual SKU count with a 90-second image upload.
- Data objectivity replaces self-reporting bias. Manual audits are systematically optimistic; image recognition produces auditable, time-stamped, location-tagged proof.
- Cycle time from observation to corrective action compresses from weeks to hours, because alerts route directly to the responsible field manager via SFA integration.
The output is not "more reports." It is a closed-loop execution system where visual data becomes the single source of truth for trade investment ROI, retailer joint business plans, and category captain conversations.
What computer vision actually measures?
This is the foundation of AI retail analytics: every shelf photograph becomes a row of structured data that joins your sell-out, distribution, and trade spend datasets.
AI Vision Inspection and Merchandising Compliance
AI vision inspection is the automated comparison of an actual shelf image against a prescribed planogram, returning a compliance score, deviation map, and SKU-level corrective action list within seconds.
Merchandising compliance is where most CPG brands lose the largest dollar value of trade investment. Industry benchmarks show manufacturers spend 15% to 25% of gross revenue on trade promotions, yet only 30% to 40% of that spend produces a positive ROI — primarily because negotiated executions never appear on the shelf.
Computer vision automates the four highest-value compliance checks:
- Planogram compliance scoring. The system measures actual SKU placement, facings, and shelf position against the agreed planogram and returns a numeric compliance percentage per outlet, per category, per visit.
- POSM validation. Endcaps, gondolas, hangers, wobblers, shelf talkers, and floor displays are detected and matched against the trade plan. A "100% executed" claim from a regional team is now verifiable in 24 hours, not 24 days.
- Premium placement enforcement. Eye-level shelves, gold-zone positions, and category captain entitlements are tracked at the facing level. Slotting fees become defensible only when occupancy is provable.
- Pricing accuracy. OCR layered on the image extracts shelf-edge price labels, comparing them against approved MAP and promotional price files.
The financial logic is direct: every 1% improvement in planogram compliance for a category leader translates to 0.5% to 1% in incremental category sales, because shoppers buy what they can find in the position they expect to find it.
Store Shelf Analysis & Layout Optimization Technologies
Store shelf analysis is the systematic measurement of product adjacency, vertical block, eye-level allocation, and category flow across a retail estate using image-based data, with the objective of maximizing transaction value.
Shelf layout is not a creative exercise. It is a math problem with measurable outputs. Shelf monitoring software quantifies the variables that determine basket size:
- Vertical block integrity. Brand block continuity drives faster shopper decision-making. CV systems measure block fragmentation and flag categories where a key SKU has been displaced into a competitor's territory.
- Eye-level share. Shelves between 48 and 60 inches off the ground generate disproportionate sales velocity. Image data quantifies actual eye-level facings versus contracted facings.
- Adjacency analysis. Pasta next to sauce. Razors next to shaving cream. Salty snacks next to soft drinks. CV-extracted shelf maps confirm whether high-affinity adjacencies are intact across the chain.
- Category flow. The sequence in which categories appear in the aisle drives basket size. Layout optimization compares actual flow to the retailer's category strategy and identifies stores where the flow has degraded.
The output feeds two decisions: which stores require a reset, and which retailer planograms need renegotiation. Brands that run continuous shelf analysis report basket-size lifts of 3% to 8% in resets driven by image-recognition data, against zero lift in resets driven by intuition.
Improved On-Shelf Availability & Inventory Management Automation
On-shelf availability (OSA) is the percentage of listed SKUs physically present at the correct shelf position at the moment a shopper arrives — measured from the shopper's perspective, not the retailer's inventory system.
OSA is the most expensive metric in CPG, and the most chronically misreported.
The size of the leak:
- Industry OSA target: 98%. Industry actual: 92% to 95%. That gap is real revenue, every day, in every store.
- 8% of SKUs are out of stock at any given time across U.S. retail.
- 51% of products experience at least one stockout per year.
- 72% of stockouts are caused by retailer-side execution failures — wrong shelf, backroom inventory, replenishment lag — not upstream supply chain disruption.
- After a single stockout, 9% of consumers switch permanently to a competitor brand. After repeated stockouts at the same retailer, that figure rises to 55%.
The traditional OSA workflow:
- Field rep visits store on a 14-day cycle.
- Rep emails or logs a missing-SKU report.
- KAM contacts retailer buyer.
- Replenishment occurs 7 to 21 days later.
- Total OOS duration: 21 to 35 days. Lost sales per SKU per store: documented.
The computer-vision-automated OSA workflow:
- Rep or in-store camera captures shelf image.
- Image processed in seconds; missing SKUs flagged.
- Replenishment alert routes automatically to distributor, retailer category manager, or internal supply chain via API.
- Total OOS duration: 24 to 72 hours.
The compression of cycle time is where the revenue is recovered. Reducing average OOS duration from 14 days to 2 days on a $50M brand recovers $4M to $7M in annualized sell-out — without a dollar of new media spend.
Competitive Analysis with Computer Vision for Retail
Share of Shelf (SoS) is the percentage of total facings, linear shelf inches, or shelf area that a brand occupies within its category in a given outlet — a leading indicator of market share six to nine months forward.
SoS has historically been measured by audit firms running quarterly samples in a few hundred stores. Computer vision changes the math by enabling continuous SoS measurement across thousands of outlets simultaneously.
What this gives a VP of Sales:
- Real-time competitive incursion alerts. When a competitor wins additional facings in a key chain, the system flags it within the same execution cycle, not the next quarterly review.
- Category captain defense. If your brand pays for category captaincy, CV data is the evidence file for whether the retailer is honoring the agreement.
- Promotional response measurement. When a competitor runs a price promotion, CV captures the resulting facing shifts and price compression in the surrounding SKUs — informing your counter-pricing decision.
- New product launch tracking. Competitor NPDs are detected at the shelf within days of launch, with photo evidence of position, pricing, and POSM support.
For a Retail Execution Director, this converts competitive intelligence from a lagging quarterly report into a leading weekly KPI that drives field deployment decisions. The brand that knows its SoS by store, by week, by competitor wins the trade negotiation in the next JBP cycle.
Streamlining the Shopper Journey: Faster Checkouts & Lower Return Rates
Shopper journey optimization is the use of computer vision to reduce friction at three measurable points: shelf-finding, checkout throughput, and post-purchase product integrity.
For a CPG manufacturer, three checkout-side outcomes are directly tied to brand performance:
- Faster checkouts reduce abandonment. Walkout rates above 2% during peak hours represent direct revenue loss to the retailer — and indirect loss to the brand whose shopper just left without the product.
- Self-checkout shrink is a brand-specific risk. Computer vision at self-checkout terminals confirms scan accuracy and produces SKU-level shrink data that retailers increasingly share with their top suppliers.
- Return rate reduction through visual quality verification. Image recognition at receiving, on the shelf, and at checkout flags damaged packaging, expired dating, and incorrect labeling before the product enters the shopper's basket — reducing returns and the associated reverse-logistics cost.
The connection to FMCG operations is direct: every percentage point of return rate reduction on a major SKU recovers margin that no promotional plan can replicate.
Step-by-Step Implementation Guide for Retail Executives
Deploying computer vision is a structured program, not a software purchase. The following three-phase sequence mirrors the rollout pattern used by FMCG leaders running CV across thousands of outlets.
Phase 1: Pilot Design and KPI Alignment (Weeks 1 to 8)
- Select a pilot universe of 50 to 200 stores across two or three retail formats. Mix high-volume chains, traditional trade, and modern trade to test model accuracy across shelf conditions.
- Define three to five primary KPIs. Recommended starting set: planogram compliance %, OSA %, Share of Shelf %, must-sell SKU visibility %, and promotional execution rate.
- Establish baselines using two cycles of manual audit alongside the CV system to validate accuracy. Industry benchmark: production-grade CV systems achieve 95%+ SKU recognition accuracy on trained categories.
- Set the ROI hurdle in dollar terms. Example: a 2-point OSA improvement on a $200M brand recovers $4M in sell-out, against a CV deployment cost of a fraction of that figure.
Phase 2: Field Team Onboarding and Process Redesign (Weeks 6 to 16)
- Retrain field reps on the new visit cadence. Image capture replaces manual SKU counting. Visit time per store typically drops by 30% to 50%.
- Re-architect the SFA workflow so corrective actions auto-generate from CV alerts and route to the responsible person without manual intervention.
- Redesign incentive structures. Compensation should now be tied to CV-verified compliance scores, not self-reported visit counts.
- Pilot two-way communication. The field team should receive shelf-level alerts on their handheld within the same visit cycle, enabling same-day correction.
Phase 3: API and ERP Integration at Scale (Weeks 12 to 24+)
- Integrate CV outputs with the SFA system so every alert, score, and KPI flows into the existing field-team interface — no parallel app, no duplicate reporting.
- Connect CV data to the DMS and ARS so OOS alerts trigger replenishment orders automatically through the distributor.
- Push compliance dashboards into BI tools (Power BI, Tableau, Looker) used by sales leadership and trade marketing.
- Pipe trade execution data into the trade promotion management system to close the loop between trade investment and on-shelf reality, producing a true Trade Spend ROI calculation.
- Scale from pilot universe to full national footprint in tranches of 1,000 to 5,000 stores per quarter.
The end-state is a single execution data model running across SFA, DMS, Image Recognition, and ERP — with the field rep's smartphone as the primary data capture device and the C-suite's BI dashboard as the primary decision surface.
FieldAssist IRIS: The Best Software for FMCG Retail Execution & Shelf Intelligence

Most computer vision vendors stop at image recognition. FieldAssist IRIS is built for the operational reality of FMCG: thousands of distributors, hundreds of thousands of outlets, dozens of categories, and a field force that needs answers — not raw data — inside the store.
IRIS is the image recognition module of the FieldAssist execution platform, used by leading CPG brands including Coca-Cola, Unilever, Bisleri, Beiersdorf, Parle, Mars, Haldiram, Cello, and Nivea. The platform tracks $23.6 billion in GMV across 8.9 million outlets in 32+ countries, supporting 190,000+ field users and 75,000+ distributors.
What IRIS delivers, in measurable terms
- 30% improvement in planogram compliance through real-time deviation detection and faster correction workflows.
- 25% reduction in stockout resolution time via automated digital shelf monitoring.
- 20% increase in must-sell SKU visibility at point of purchase.
- 30% faster gap resolution cycle from photo capture to corrective action closure.
- 100% in-store execution visibility for category and trade marketing leaders.
The five core IRIS capabilities
- AI Shelf Intelligence. Captures shelf photos and converts them into structured insights — gap detection, misplaced SKUs, compliance errors — across categories, layouts, and store formats.
- Planogram Compliance Automation. Replaces manual audits with auto-generated compliance scores, deviation alerts, and priority SKU placement verification routed to compliance dashboards.
- Retail Shelf Analytics. Granular analytics by store, region, SKU, and category, including real-time OOS flagging, competitive SoS tracking, and promotional execution validation.
- Task & Audit Automation. Corrective actions assigned instantly to the responsible field user, prioritized by execution gap and revenue exposure, with shelf-linked audit accountability.
- Real-Time Execution Tracking. Live alerts for missed tasks, planogram deviations, and promotion failures, surfacing immediately to leadership through real-time analytics dashboards.
Why IRIS over a standalone CV vendor
A point-solution image recognition tool gives you a score. IRIS gives you the closed loop:
Standalone vendors require integration engineering across four to six systems before a single alert reaches a field rep. IRIS ships with that integration as the product.
The bottom-line case
Up to 25% of CPG sales are lost to compliance failures and stockouts at the shelf. IRIS recovers a measurable share of that loss by closing the gap between visual evidence and corrective action — at the speed of the next store visit, not the next quarterly review.
For C-suite leaders evaluating computer vision retail automation, the decision is not whether to deploy. It is whether to deploy a tool that produces reports, or a system that produces revenue.


.avif)