Demand Forecasting in Supply Chain: Methods, Examples & The AI Shift (2026 Guide)
Master demand forecasting in supply chain management. Discover the key differences from demand planning, 6 proven methods (qualitative vs. quantitative), and how AI is fixing forecast accuracy in sales and distribution.

You can’t grow in a market without having the capability to forecast demand in retail, especially when you know how volatile the Fast Moving Consumer Goods (FMCG) industry can be across thousands of SKUs and millions of stores.
Demand forecasting in supply chain management is a game-changer for organizations that want to scale with discipline. With accurate forecasting on patterns (such as consumer trends, seasonal variations, and promotional impact), a brand can align inventory levels precisely with projected demand. Thus, slashing stockouts and overstocking incidents while minimizing waste.
Some industry leaders also report that FMCG brands with real-time POS forecasting reduce perishable waste. This is one of many reasons FMCG businesses are considering Advanced predictive analytics for forecasting, enabling them to process real-time, transaction-level data, predict future demand, optimize inventory levels, enhance supply chain planning, and boost customer retention.
This is what we will cover in this blog in detail, so you can set clear priorities for future growth.
What is Demand Forecasting?
Demand forecasting is the structured, data-driven, analytic process of estimating future customer demand for a product or service using historical sales data, market trends, and statistical modeling. By predicting how much inventory is needed at a specific time, supply chain leaders can optimize stock levels, reduce holding costs, and prevent stockouts. Moreover, Thus, enabling a business to plan production, procurement, inventory, and distribution with confidence.
In supply chain management, demand forecasting connects sales targets with operational execution. It plays a central role in sales and distribution management by aligning field demand signals, distributor orders, and warehouse planning into one coordinated view.
Instead of reacting to orders after they arrive, organizations anticipate demand and prepare in advance by analyzing historical sales data, seasonal patterns, market trends, channel behavior, and commercial inputs to forecast demand for a given period.
Let’s further understand what demand forecasting is with an example:
- For a dairy brand, demand forecasting must account for short shelf life, daily replenishment cycles, and regional consumption patterns. A small forecasting error can lead to spoilage or stockouts within days.
- In the cosmetic industry, demand forecasting looks different. Seasonal promotions, influencer campaigns, and regional preferences can sharply increase demand for specific SKUs. Here, forecasting helps avoid excess slow-moving inventory while ensuring fast-moving products remain available in high-selling outlets.
In simple terms, demand forecasting predicts key market questions: how much to produce, how much to stock, and how much to distribute without wasting money.
That is why demand forecasting in supply chain management is a core pillar of scalable, predictable growth, especially for CPG and FMCG companies operating across multiple SKUs, regions, and channels.
Key benefits of accurate demand forecasting
An accurate demand forecasting in supply chain management does not just improve a number on a report. It improves business stability.
When demand planning and forecasting are structured and supported by the right demand forecasting software, organizations begin to see measurable operational impact.
- Stock-outs reduce. Products are available where demand actually exists, improving fill rates and protecting revenue.
- Excess inventory declines. Instead of overproducing based on optimistic assumptions, businesses align production with realistic demand signals. This directly improves inventory planning and reduces write-offs.
- Cash flow improves. Lower excess inventory means less working capital locked in warehouses. Procurement and production schedules become more disciplined.
- Service levels become more predictable. Distribution teams can commit to customers with greater confidence.
- Cross-functional friction reduces. Sales, supply chain, and finance operate on shared demand visibility rather than conflicting numbers.
Consider a simple example. When demand forecasts are inaccurate, inventory often piles up in one region while another runs dry. One warehouse discounts stock to clear space, while another loses sales due to shortages. Better demand forecasting prevents this imbalance by aligning supply with true regional demand signals.
Demand Forecasting vs. Demand Planning: What’s the Difference?
One of the most common questions in supply chain management is: "Are demand forecasting and demand planning the same thing?" The answer is no.
Demand Forecasting is an unbiased prediction of what will happen. Demand Planning is the strategy of how you respond to that prediction.
6 Key Methods of Demand Forecasting (With Real-World Examples)
Effective demand forecasting requires a mix of Quantitative (math-based) and Qualitative (opinion-based) methods. Quantitative methods of demand forecasting include moving average, exponential smoothing, and Regression Analysis. Whereas Quantitative methods of demand forecasting include the Delphi method, the sales force composite, and Demand sensing. Let’s understand each one of them in detail:
1. Moving Average (Quantitative)
- How it works: Calculates the average of sales over a specific past period (e.g., last 3 months historical sales) to predict the next month. It "smooths out" short-term fluctuations.
- Best For: Stable products with consistent demand.
- Real-World Example: A dairy brand forecasting sales for Pasteurized Milk. Since consumption is daily and stable, a 3-month rolling average provides a reliable baseline without overreacting to one-day spikes.
2. Exponential Smoothing (Quantitative)
- How it works: Similar to moving averages but assigns more weight to recent data.
- Best For: Products seeing a recent trend change (upward or downward).
- Real-World Example: An FMCG snack brand noticing a sudden spike in a specific flavor due to a viral social media trend. Exponential smoothing will weight last month’s high sales more heavily than sales from 6 months ago.
3. Regression Analysis (Quantitative)
- How it works: A statistical method that correlates demand with other variables (dependent vs. independent variables).
- Best For: Understanding cause-and-effect.
- Real-World Example: An Ice Cream manufacturer correlating sales (dependent) with local temperature (independent). As the temperature rises by 1°C, sales historically rise by 4%.
4. The Delphi Method (Qualitative)
- How it works: A panel of experts answers questionnaires in multiple rounds. After each round, a facilitator provides an anonymous summary of the experts’ forecasts. The experts then revise their answers based on the group's response.
- Best For: New Product Launches (NPD) where no historical data exists.
- Real-World Example: A tech company launching a revolutionary new wearable device. Since they can't look at past sales, they rely on a panel of market analysts and retail partners to estimate initial demand.
5. Sales Force Composite (Qualitative)
- How it works: Aggregating the personal forecasts of the sales team (who are closest to the customer).
- Best For: B2B industries or General Trade.
- Real-World Example: An Automotive Lubricants company asks their regional distributors: "How much engine oil do you expect to sell to mechanics next quarter?" The aggregate of these answers forms the forecast.
6. Demand Sensing (AI/Machine Learning)
- How it works: Using AI to analyze real-time data signals (weather, competitor prices, local events) to adjust the forecast daily or hourly.
- Best For: Highly volatile markets and e-commerce.
How Demand Forecasting Directly Supports Key Core Sales and Distribution Decisions
Demand forecasting directly influences key areas of sales and distribution management decisions. When demand forecasting is structured and data-driven, sales targets, distributor planning, and supply execution operate on the same demand reality.
In simple terms, forecasting ensures that what sales commits, distribution executes, and supply produces are aligned.
Below is how demand forecasting in supply chain management supports core sales and distribution decisions:
How to Measure if Your Demand Forecast Is Working as planned or not?
Demand forecasting in supply chain is useful only if it improves execution on the ground. The goal is not to achieve a perfect percentage. The goal is to reduce stock friction, improve fill rates, and stabilize inventory.
Here are the key indicators that show whether your demand forecasting is actually working.
1. WAPE (Weighted Accuracy at Business Level)
WAPE measures total forecast error against total actual demand. In simple terms, it shows how far off your forecast was compared to what the market actually bought.
Why it is better than MAPE (Mean Absolute Percentage Error) in sales and distribution:
- It naturally gives more weight to high-volume SKUs.
- It avoids distortion caused by very small or slow-moving products.
- It reflects real revenue impact, not just mathematical variance.
Business impact: If WAPE improves, it usually means fewer surprises in primary sales, smoother distributor replenishment, and better regional stock alignment.
2. Forecast Bias (Are You Consistently Over or Under?)
Bias shows whether your forecast regularly overshoots or undershoots demand.
- Consistent over-forecasting leads to excess distributor inventory and blocked working capital.
- Consistent under-forecasting results in stock-outs and lost sales opportunities.
In sales and distribution, bias is often more dangerous than occasional error. It signals structural planning issues.
Business impact: Lower bias means healthier distributor relationships and more reliable sales planning.
3. Service Level Impact (Fill Rate and Availability)
A forecast must ultimately protect service levels.
If forecasting improves but fill rates remain unstable, the model is not supporting distribution correctly.
Track:
- On-Time-In-Full (OTIF)
- Fill rate at warehouse and distributor level
- SKU availability in key regions
Business impact: Improved service levels translate directly into stronger retailer confidence and repeat demand.
4. Inventory Days (Working Capital Discipline)
Inventory days show how long stock sits before it is sold. When demand forecasting in supply chain management improves:
- Inventory days reduce without harming service levels.
- Slow-moving SKUs are identified early.
- Regional imbalances decline.
Business impact: Lower inventory days free up cash, reduce obsolescence risk, and improve return on capital.
5. Forecast Adoption by Sales Teams (Often Ignored but Critical)
Even the best demand forecasting software fails if sales and distribution teams do not trust it.
Measure:
- Percentage of forecast overridden
- Frequency of last-minute target adjustments
- Alignment between forecast and final dispatch plan
Business impact: Higher adoption means forecasting is becoming an operational discipline, not just a reporting exercise.
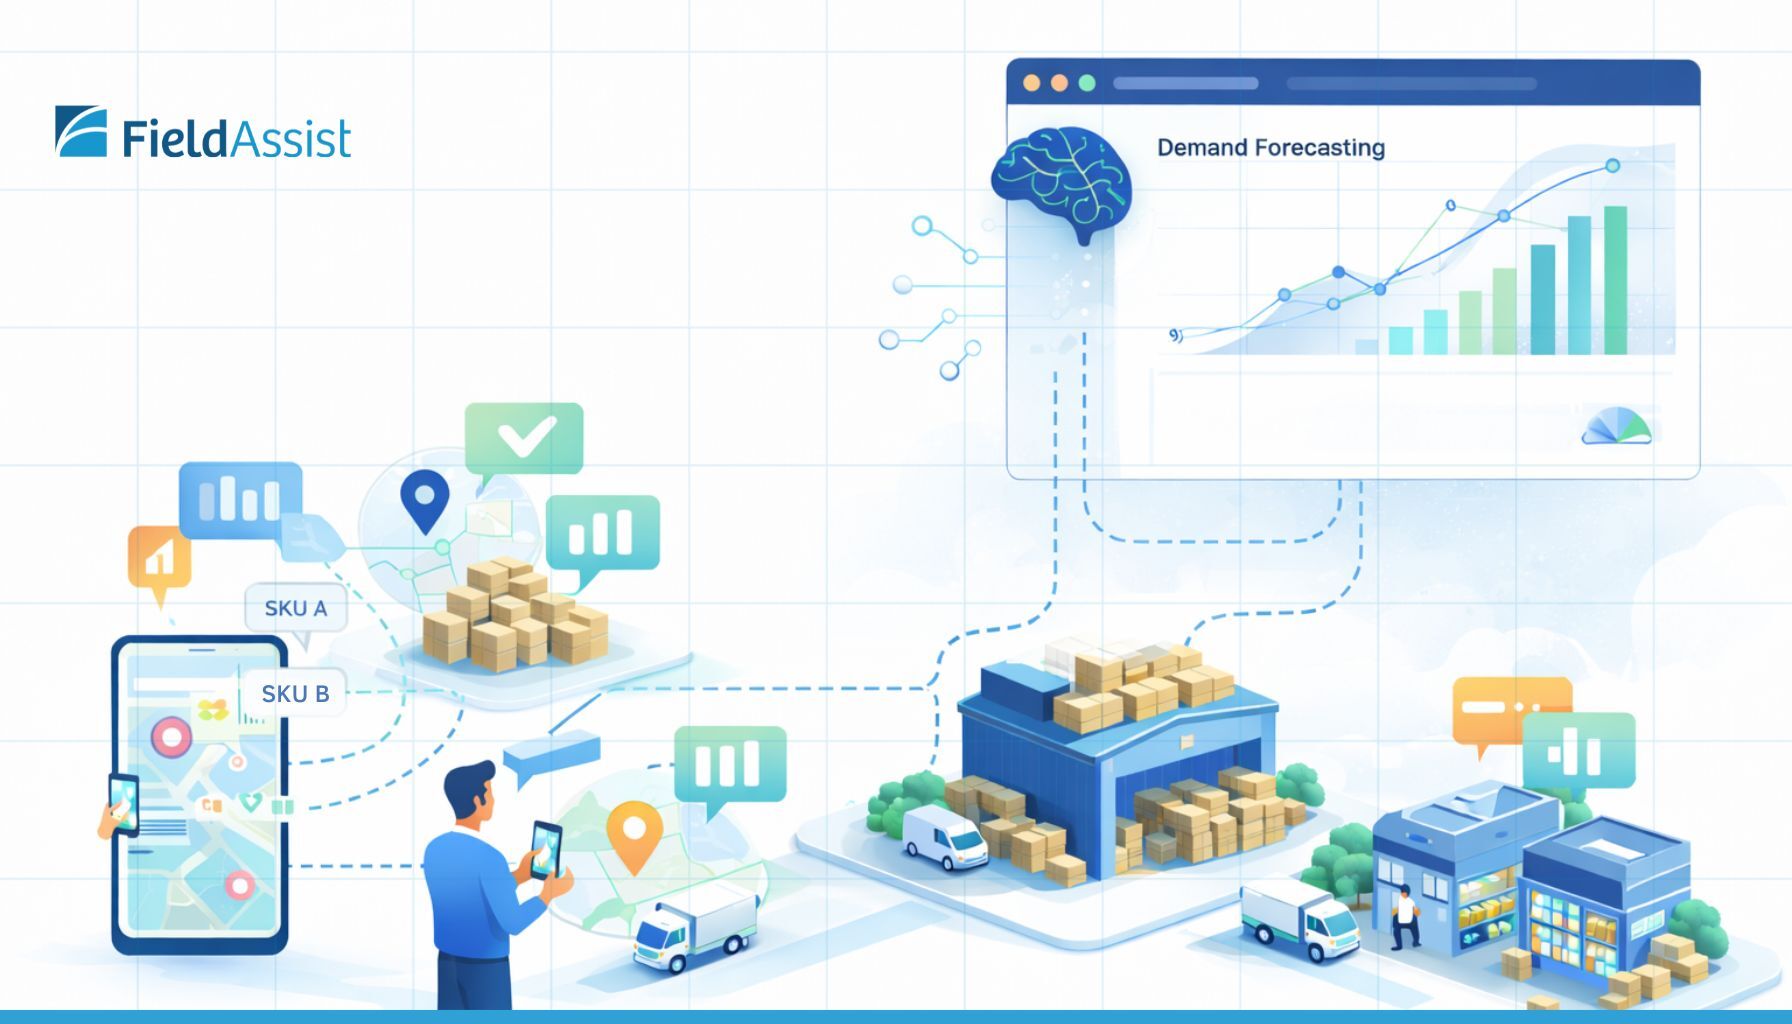
Using AI for Smarter Demand Forecasting
Modern supply chains generate large volumes of data, i.e., primary sales, secondary sales, distributor stock, field visits, scheme performance, outlet coverage, and SKU-level execution. The challenge is not data availability. The challenge is converting that data into forecasting intelligence.
This is where AI demand forecasting in retail and distribution ecosystems becomes powerful for organizations operating across thousands of SKUs and multiple regions. Once you have an artificial intelligence (AI) engine in place.
Frequently Asked Questions (FAQ)
Q: What is the most accurate method of demand forecasting?
There is no single "most accurate" method. The best approach is a weighted combination: using Quantitative methods (like Exponential Smoothing) for the baseline, and adjusting it with Qualitative insights (like the Delphi method) for market context.
Q: How does seasonality affect demand forecasting?
Seasonality creates predictable spikes or dips in demand (e.g., umbrella sales in monsoon). Forecasting models must use "seasonal indices" to adjust the baseline forecast up or down during these specific months to avoid stockouts.
Q: What is MAPE in demand forecasting?
MAPE stands for Mean Absolute Percentage Error. It is the standard KPI for measuring forecast accuracy. A lower MAPE means a more accurate forecast. (e.g., A MAPE of 10% means the forecast was, on average, 10% off from the actual sales).
Q: What’s the role of SFA in demand forecasting and planning?
Sales Force Automation (SFA) solution serves as the "Real-Time Sensor" for demand planning by capturing granular field data, such as outlet preferences, purchase history, SKU category, quantity, package size preferences, etc. SFA provides visibility into secondary sales and tertiary consumption impeorving forecast in three critical ways:
- Capturing Lost Demand: SFA tracks stockouts in real time so forecasts reflect true demand.
- Granular Data Inputs: SFA forecasts using outlet- and SKU-level trends instead of broad regional averages.
- Market Context: Sales Force Automation factors in competitor price changes and local events so short-term spikes aren’t mistaken for long-term demand trends.
Still have questions? Curious how demand forecasting software can unlock smarter decisions and stronger growth for your brand? Let’s connect today.


.avif)
%205%20(1).avif)