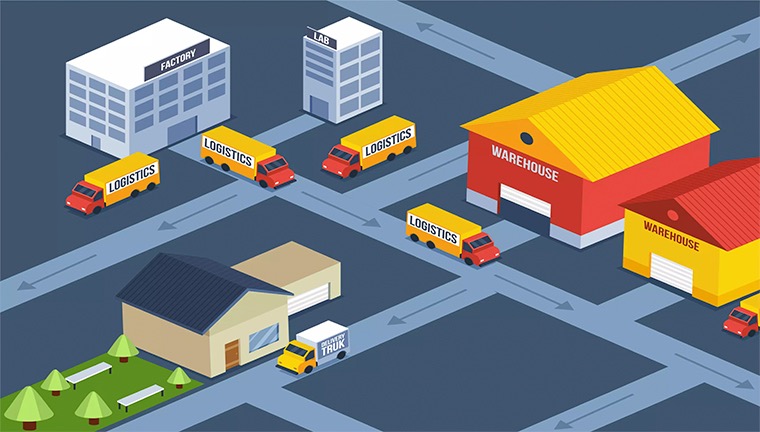
With the advancements in technology and adoption of big data, retail industry is learning more about its customers than ever before. Sales as a function is rapidly transforming as it embraces technology such as field force automation software to improve sales force efficiency levels, enhance merchandising levels, expand to wider geographies, streamline beat plans and subsequently boost revenues. Owing to the availability of granular data today, every sales activity is therefore expressed as a derivative of the investment incurred on that activity.
In other words, every delta spent must deliver an average return on investment (ROI). In the context of retail sales, it is important to understand the efficacy of the relationship between sales deliverables and ROI. They are inter-dependent in nature and largely responsible for driving organizational growth. In this article, we aim at listing general sales activities of a field executive of an organization and how can data derived from sales technologies such as SFA app help in making informed business decisions.
To do that, we begin by listing down the major activities of a sales executive during a day in Indian retail context such that it gets easier to break them down into levers that are under control and therefore translate into increased ROI:
PJP adherence | Maximize unique SKUs sold per call | Maintain product merchandising at every store |
Highlight promotional offers | Relationship management with the Retailer | Deliver volume |
Inventory |
Lately, more and more marketers drive profitable sales growth without increasing their marketing spends but through optimization and automation tools, on-ground efforts are allocated effectively and deliver the strongest return.
For sales executives to keep track of their goals and update them in real time, calculating ROI on sales activities on a regular basis is an important determinant that significantly enhances the probability of securing the desired targets.
We have identified 3 ways to measure effectiveness of sales force and its activities for your organization:
Table of Contents
ToggleCalculate the cost of your sales team
Assuming, the total no. of sales people in your team is 20.
Averagely, the salary pay out per person is Rs. 20000.
Additional cost of automation software per sales person is ZThus, the annual investment in the sales team is = 20 x 20000 x Z x 12 = Rs. 48,00,000 x ZSales leaders will therefore be interested in the annual revenue contribution made by each of these employees to calculate the ROI for each of them. This will also depend on other factors such as total sales budgets, marketing spends, company revenues among others and arrive at % that determines employee productivity for the organization.
Determine Sales Activity metrics
The operating metrics used to manage the sales team should be clearly defined for an organization. We have identified certain metrices and assumed the values listed in the table below. The idea is to understand the movement of sales force during a day through data shared by SFA platforms and derive business insights.
| Metrices | Count/Value | Sales Conversion | Analysis |
| Total Calls | 40 | – | – |
| Productive Calls | 23 | 23/40 | 57.5% productivity |
| New Store visits | 10 | 10/40 | 25% new opportunities discovered |
| Primary Order Count | 19 | 19/40 | 47.5% stores contributed to primary order |
| Revenue (in Rs.) | 41567 | 41567/40 (also translates to Rs12,47,010/person/month | An average deal size of Rs1039/day procured from each store |
The current activity levels for each of these metrices must be measured and compared regularly to past data. FMCG organizations that engage field force automation software as a sales tool can easily access this data and analyse the movement. On an everyday basis, sales managers can get a clear understanding of their sales team performance and evaluate them against set targets.
Further metrices can be identified, added and data can be analysed to arrive at meaningful insights for quick business decisions or corrective performance actionable.
Business Insights to drive activity levels
Sales leaders often use these insights to drive visibility into activities that salespeople must focus on and therefore take corrective performance actions to optimize ROI on sales activities. Use cases are built to evaluate sales activities and arrive at conclusive actionable to improve field force effectiveness.
For example, an organization needs to improve per month revenue contribution by Rs 2,00,000 per salesperson. Ideally, a 33% increase in the current contribution levels. Each metric therefore will undergo a change and sales plans must be made to achieve the incremental over and above the existing efforts.
Assuming a 33% increase in total revenue/month, will essentially lead to a change in every metric and the associated efforts to achieve the delta.
| Metrices | Count/Value | Increased Count/Value |
| Total Calls | 40 | 40 * 1.33 = 53 |
| Productive Calls | 23 | 23 * 1.33 = 30 |
| New Store visits | 10 | 10 * 1.33 = 13 |
| Primary Order Count | 19 | 19 * 1.33 = 25 |
| Revenue (in Rs.) | 41567 | 41567 * 1.33 = 55284 |
There are several methods that must be engaged to optimize field forces. Organizations should leverage on sales technologies today to add multiple dimensions to its determinants for effective business decisions. Brands must identify its key outlets and focus on right in-store displays and PoS materials to grow volumes. The measure of business management effectiveness should therefore be return on investment (ROI) and not merely sales volume produced, or profits earned as a percentage of sales.
Watch how a brand became category leader when millions didn’t know they need it!
About Post Author
Rashmi Kapse
Rashmi is a Content Specialist at FieldAssist. After spending 11 years in the Executive Search business she decided to change tracks and follow her passion for writing. For the past 8 years, she has been writing on Sales Tech, HR Tech, FMCG, Consumer Goods, F&B and Health & Wellness.